Smart Campus Environmental Monitoring Design Guide
A comprehensive, engineering-grade reference for deploying multi-domain environmental monitoring across industrial parks, tech campuses, office complexes, schools, and logistics parks — from sensing layer to compliance reporting.
System Overview
The Smart Campus Environmental Monitoring Design Guide defines an engineering-grade, deployable system for multi-format composite parks — including industrial parks, technology campuses, office complexes, schools, and logistics parks. The system establishes a unified chain of multi-site sensing, edge aggregation, central platform processing, alarm linkage, and operations & maintenance closed loop, enabling environmental risk to be visible, pre-warning capable, traceable, and fully auditable.
This guide is applicable to parks with mixed indoor/outdoor areas, multiple stakeholders including EHS teams, property management, and operations, and compliance needs spanning boundary noise, dust/PM, stack/vent/odor, wastewater discharge points, and data retention for audits. The system is not intended to replace full-scale process control DCS/PLC systems, nor does it serve as a certified continuous emission monitoring system requiring national metrology certification. Security video analytics is treated as a referenced integration rather than a primary function.
The system ingests sensor measurements covering PM, VOC, noise, meteorology, water quality, and energy meters, alongside device health telemetry, map/GIS layers, asset inventory, compliance thresholds, incident reports, and workflow events. Outputs include dashboards and GIS heatmaps, event/alarm notifications, regulatory evidence packages, trend reports, KPI scorecards, work orders, calibration records, and incident replay timelines. Core value is delivered through rapid detection of environmental anomalies such as odor/VOC spikes, dust events, and discharge excursions, combined with evidence-based governance, reduced complaints, improved response time, and measurable mitigation effectiveness through before/after analysis.
System Architecture
The system is organized into four distinct architectural layers, each with clearly defined responsibilities and interfaces. Data flows upward from physical sensors through edge aggregation to the central platform and ultimately to application and integration endpoints. Configuration, firmware updates, and threshold rules flow downward from the platform to edge gateways and field devices. This bidirectional architecture ensures both real-time operational responsiveness and centralized governance control.
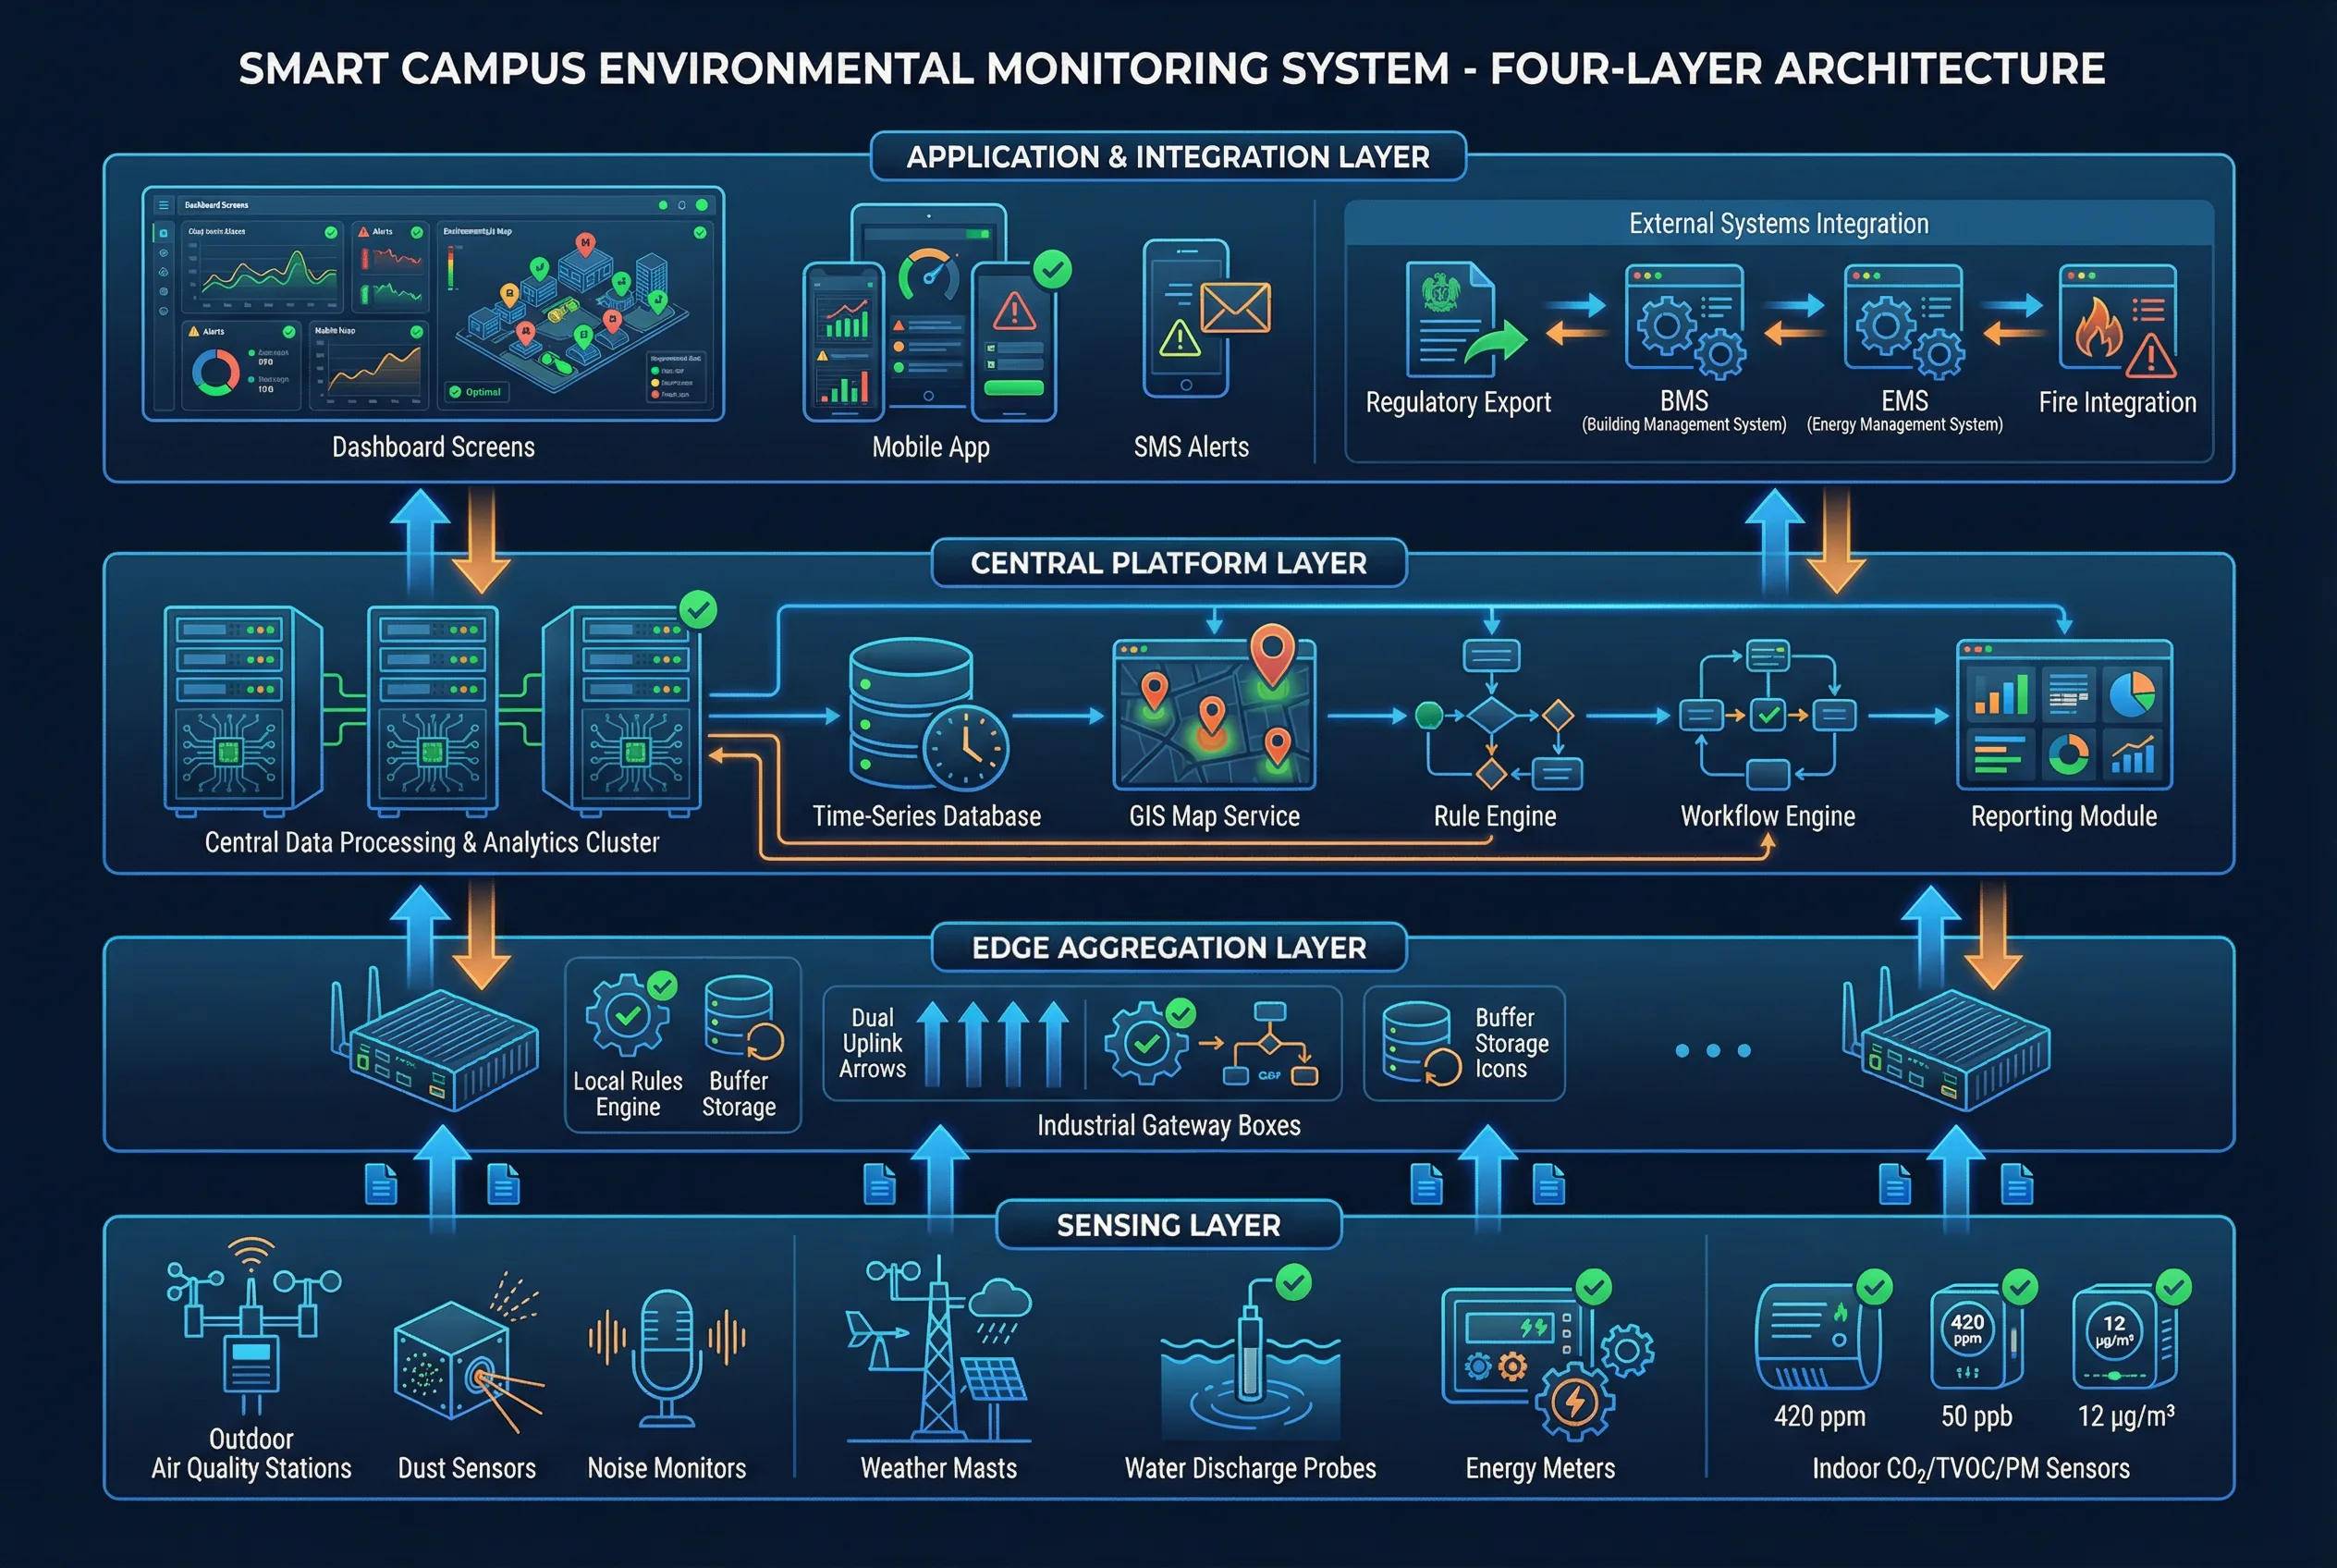
Figure 0.1: Four-Layer System Architecture — Sensing, Edge Aggregation, Central Platform, and Application & Integration Layers
Key data flows begin with measurements being normalized at the edge — including unit conversion, timestamp assignment, and QA flag generation — before being transported securely via MQTT over TLS to the central platform. The platform stores data in time-series and object storage, evaluates it against configurable rules, triggers alarms that initiate linkage actions such as SMS/IM notifications, BMS actions, and fire/security references, generates work orders, and closes the loop with root cause documentation and verification sampling evidence.
Major Functions
The platform delivers eight core functional domains, each designed to address a specific operational or compliance need. Together, these functions form a complete environmental governance lifecycle from raw sensor data to actionable intelligence and auditable evidence.
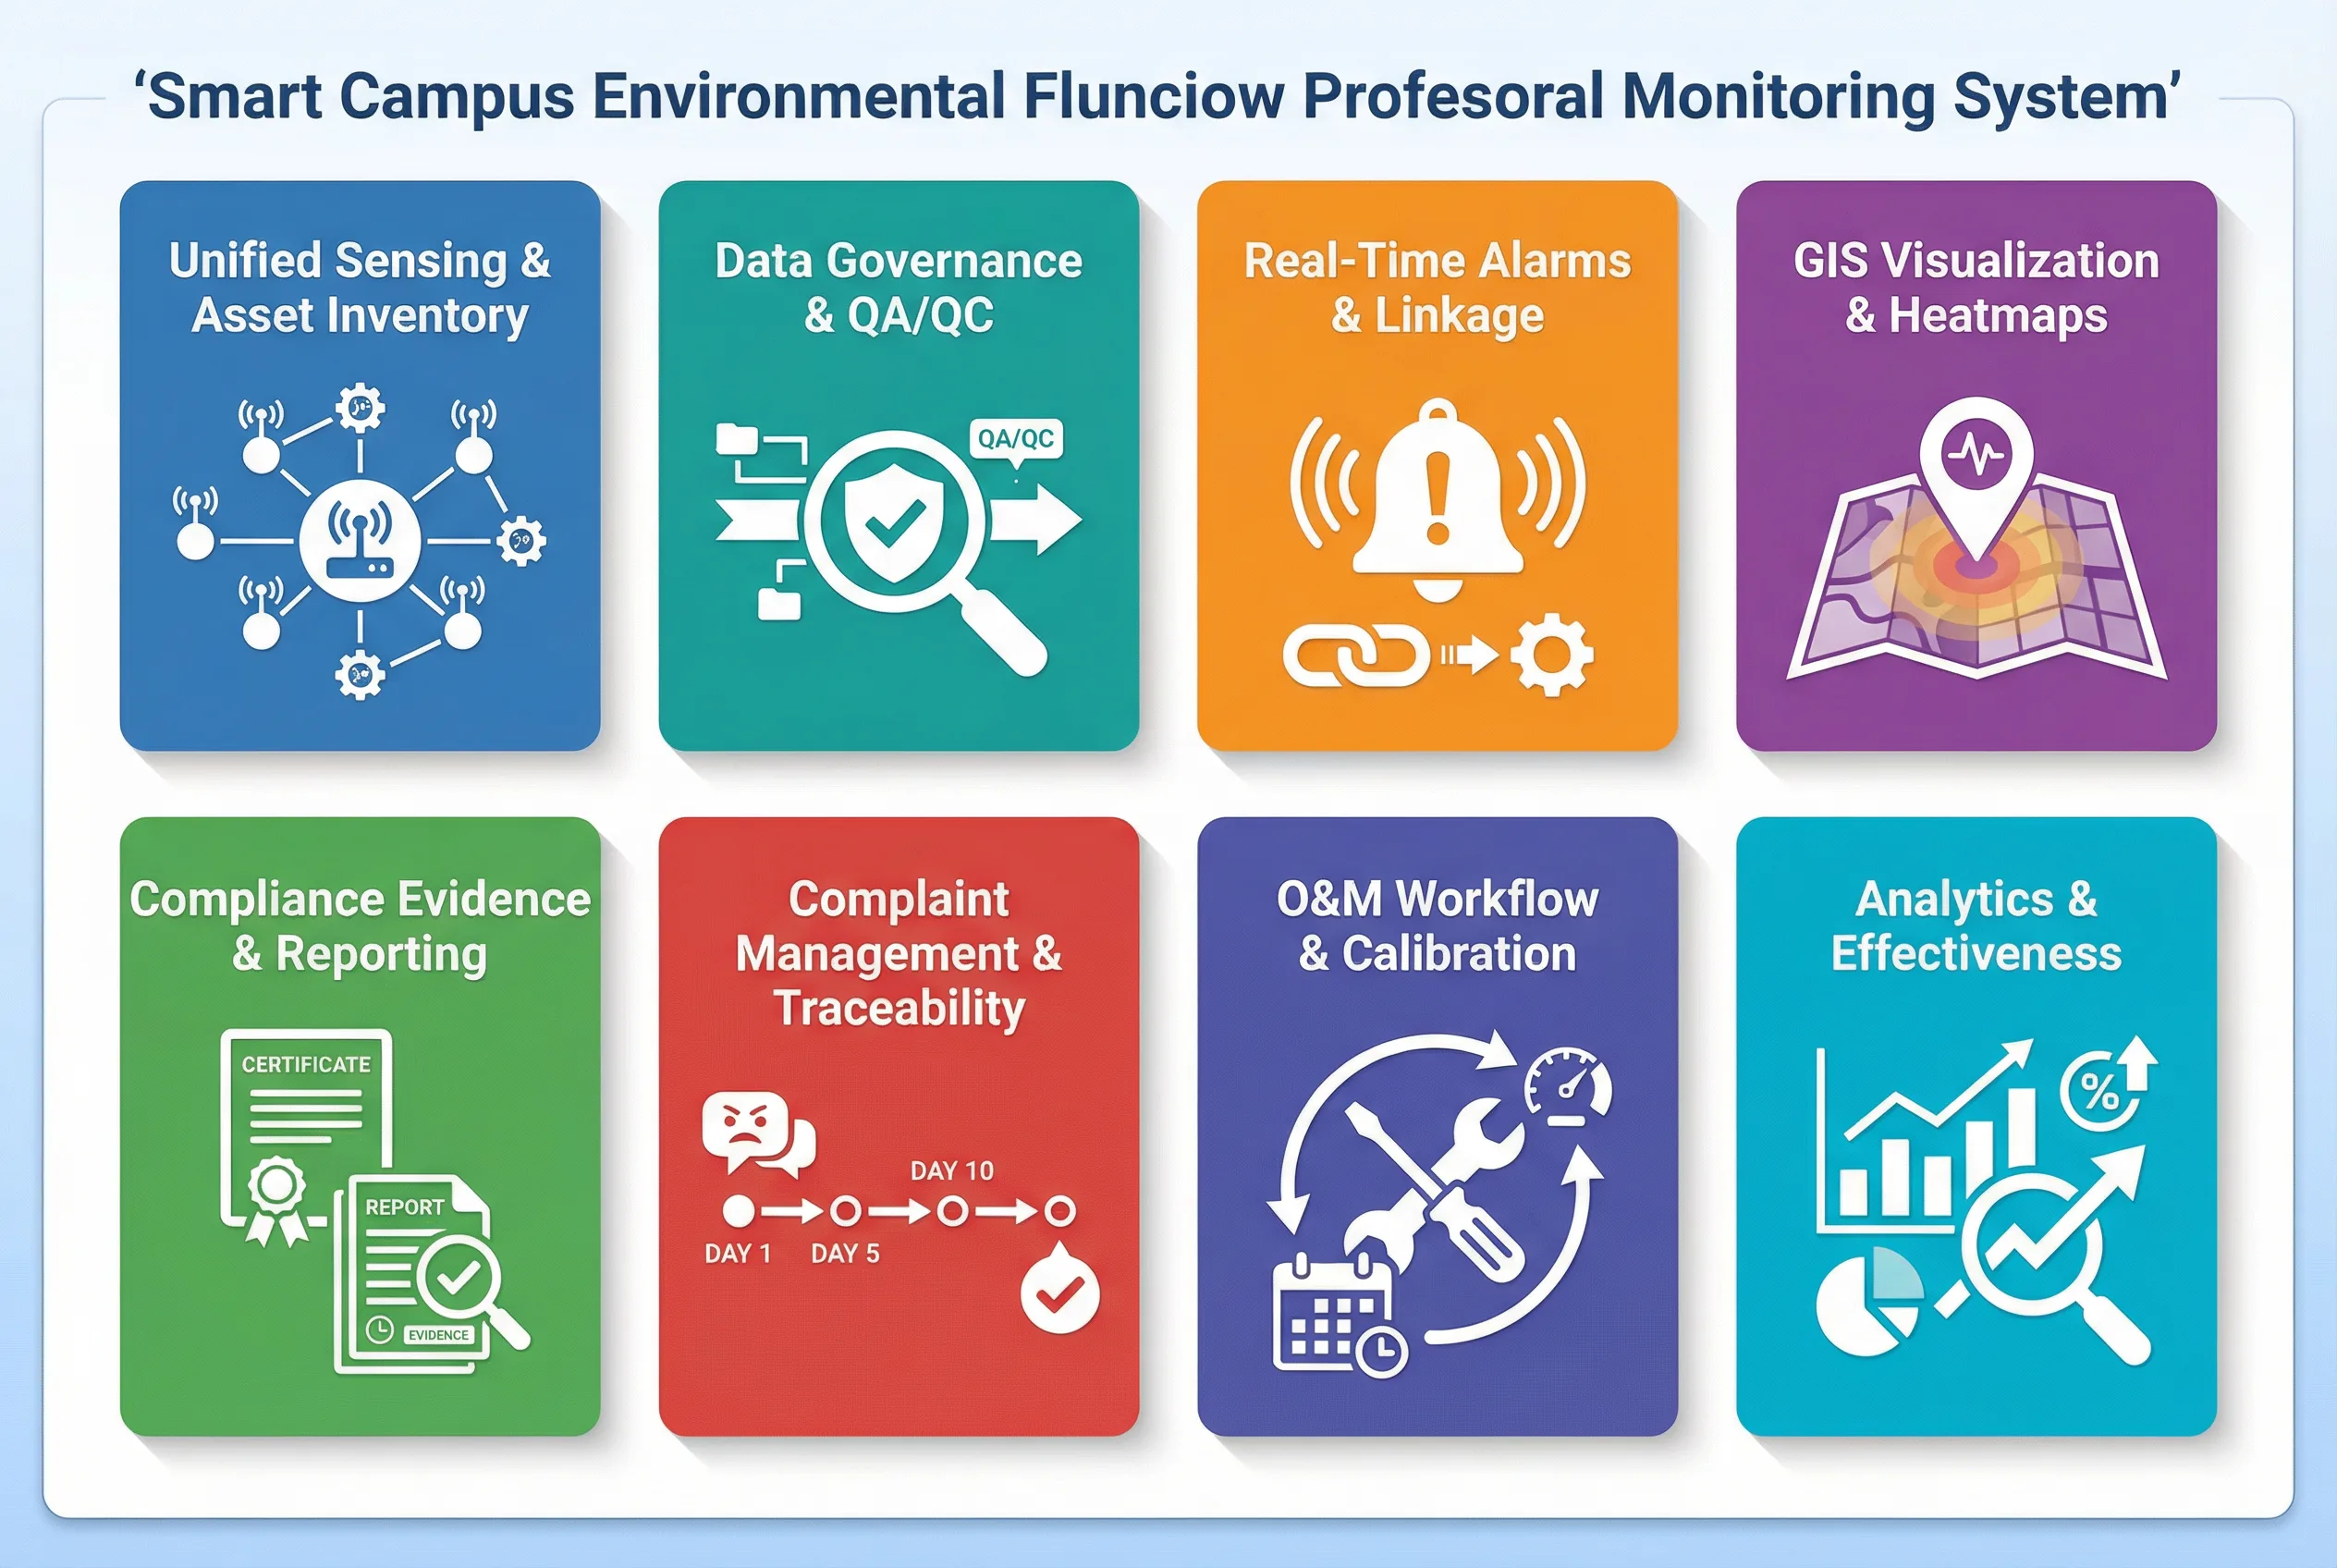
Figure 0.2: Eight Core Functional Domains of the Environmental Monitoring Platform
| Function | Description | Acceptance Focus |
|---|---|---|
| Unified Sensing & Inventory | Single asset registry for all stations; device IDs, location accuracy, tag taxonomy | Device ID uniqueness, coordinate accuracy <5m |
| Data Governance & QA/QC | Calibration status, plausibility checks, drift flags, audit trail | QA flag rate and audit trail completeness |
| Real-Time Alarms & Linkage | Multi-level thresholds, rate-of-change, composite rules, alarm deduplication | Alarm latency <60s, false alarm rate KPI |
| GIS Visualization | Station layers, boundary overlays, wind-driven plume inference, heatmaps | Map precision and role-based views |
| Compliance Reporting | Boundary/noise/dust/discharge summaries, raw data export, evidence packaging | Retention completeness and data integrity |
| Complaint/Incident Traceability | Timeline replay with wind/noise/VOC correlation, incident documentation | Reproducibility and report template coverage |
| O&M Closed Loop | Tickets, spares management, calibration tasks, MTTR/MTBF tracking | Workflow completeness and escalation paths |
| Effectiveness Evaluation | Before/after comparisons, seasonal baselines, KPI scoring | Methodology consistency and reporting cadence |
Chapter Navigation
This guide is organized into twelve chapters, each addressing a distinct engineering or operational domain. Navigate directly to any chapter using the cards below, or use the left sidebar for persistent navigation throughout the guide.
Key Dependencies & Assumptions
Successful deployment of a smart campus environmental monitoring system depends on a well-defined set of infrastructure prerequisites and operational assumptions. The table below summarizes the critical dependencies that must be verified during the site survey and design phases to ensure the system performs as specified.
| Dependency Category | Specification / Assumption | Verification Method |
|---|---|---|
| Park Size & Density | 0.8–3.0 km², 20–120 buildings, 3–15 km internal roads | Site plan / GIS survey |
| Connectivity Infrastructure | Fiber backbone, industrial Ethernet in cabinets, LoRaWAN/NB-IoT/4G/5G for remote stations | Carrier coverage test, network audit |
| Edge Strategy | Each zone has ≥1 edge gateway with ≥7 days buffer and local rule-based alarming | Gateway sizing review, storage test |
| Platform Availability | ≥99.9% platform availability; ≥99.95% critical alarm path with local fallback | SLA agreement, failover test |
| Data Retention | Hot: 90 days; Warm: 1–3 years; Cold archive: ≥5 years | Storage policy documentation |
| Power Infrastructure | AC mains primary; solar+battery for remote points; UPS for key cabinets | Utility plan, load calculation |
| Calibration & QA | Quarterly reference checks for PM/VOC; annual for meteorology; per-regulation for discharge | Calibration plan and lab support |
| Delivery Timeline | Phased delivery 8–16 weeks: survey → pilot → rollout → acceptance | Project plan review |