System Components
A comprehensive breakdown of every hardware and software component in the smart campus environmental monitoring system, including deployment boundaries, data flow paths, working principles, and exception handling chains.
1.1 System Architecture
The smart campus environmental monitoring system is structured around three clearly delineated deployment boundaries: the field layer, the zone edge layer, and the central layer. Each boundary has distinct responsibilities, hardware requirements, and failure modes. Understanding these boundaries is essential for correct system sizing, redundancy planning, and O&M staffing.
The field boundary encompasses all stations and probes installed on poles, rooftops, discharge manholes, pump rooms, boundary fences, and loading bays. These devices are exposed to the full range of environmental conditions and require robust enclosures, surge protection, and accessible mounting for maintenance. The zone edge boundary consists of aggregation cabinets or telecom rooms housing gateways, PoE switches, surge protection devices, and optional UPS units. The central boundary is either an on-premises server room or a cloud virtual private cloud containing platform services, storage systems, and integration endpoints.
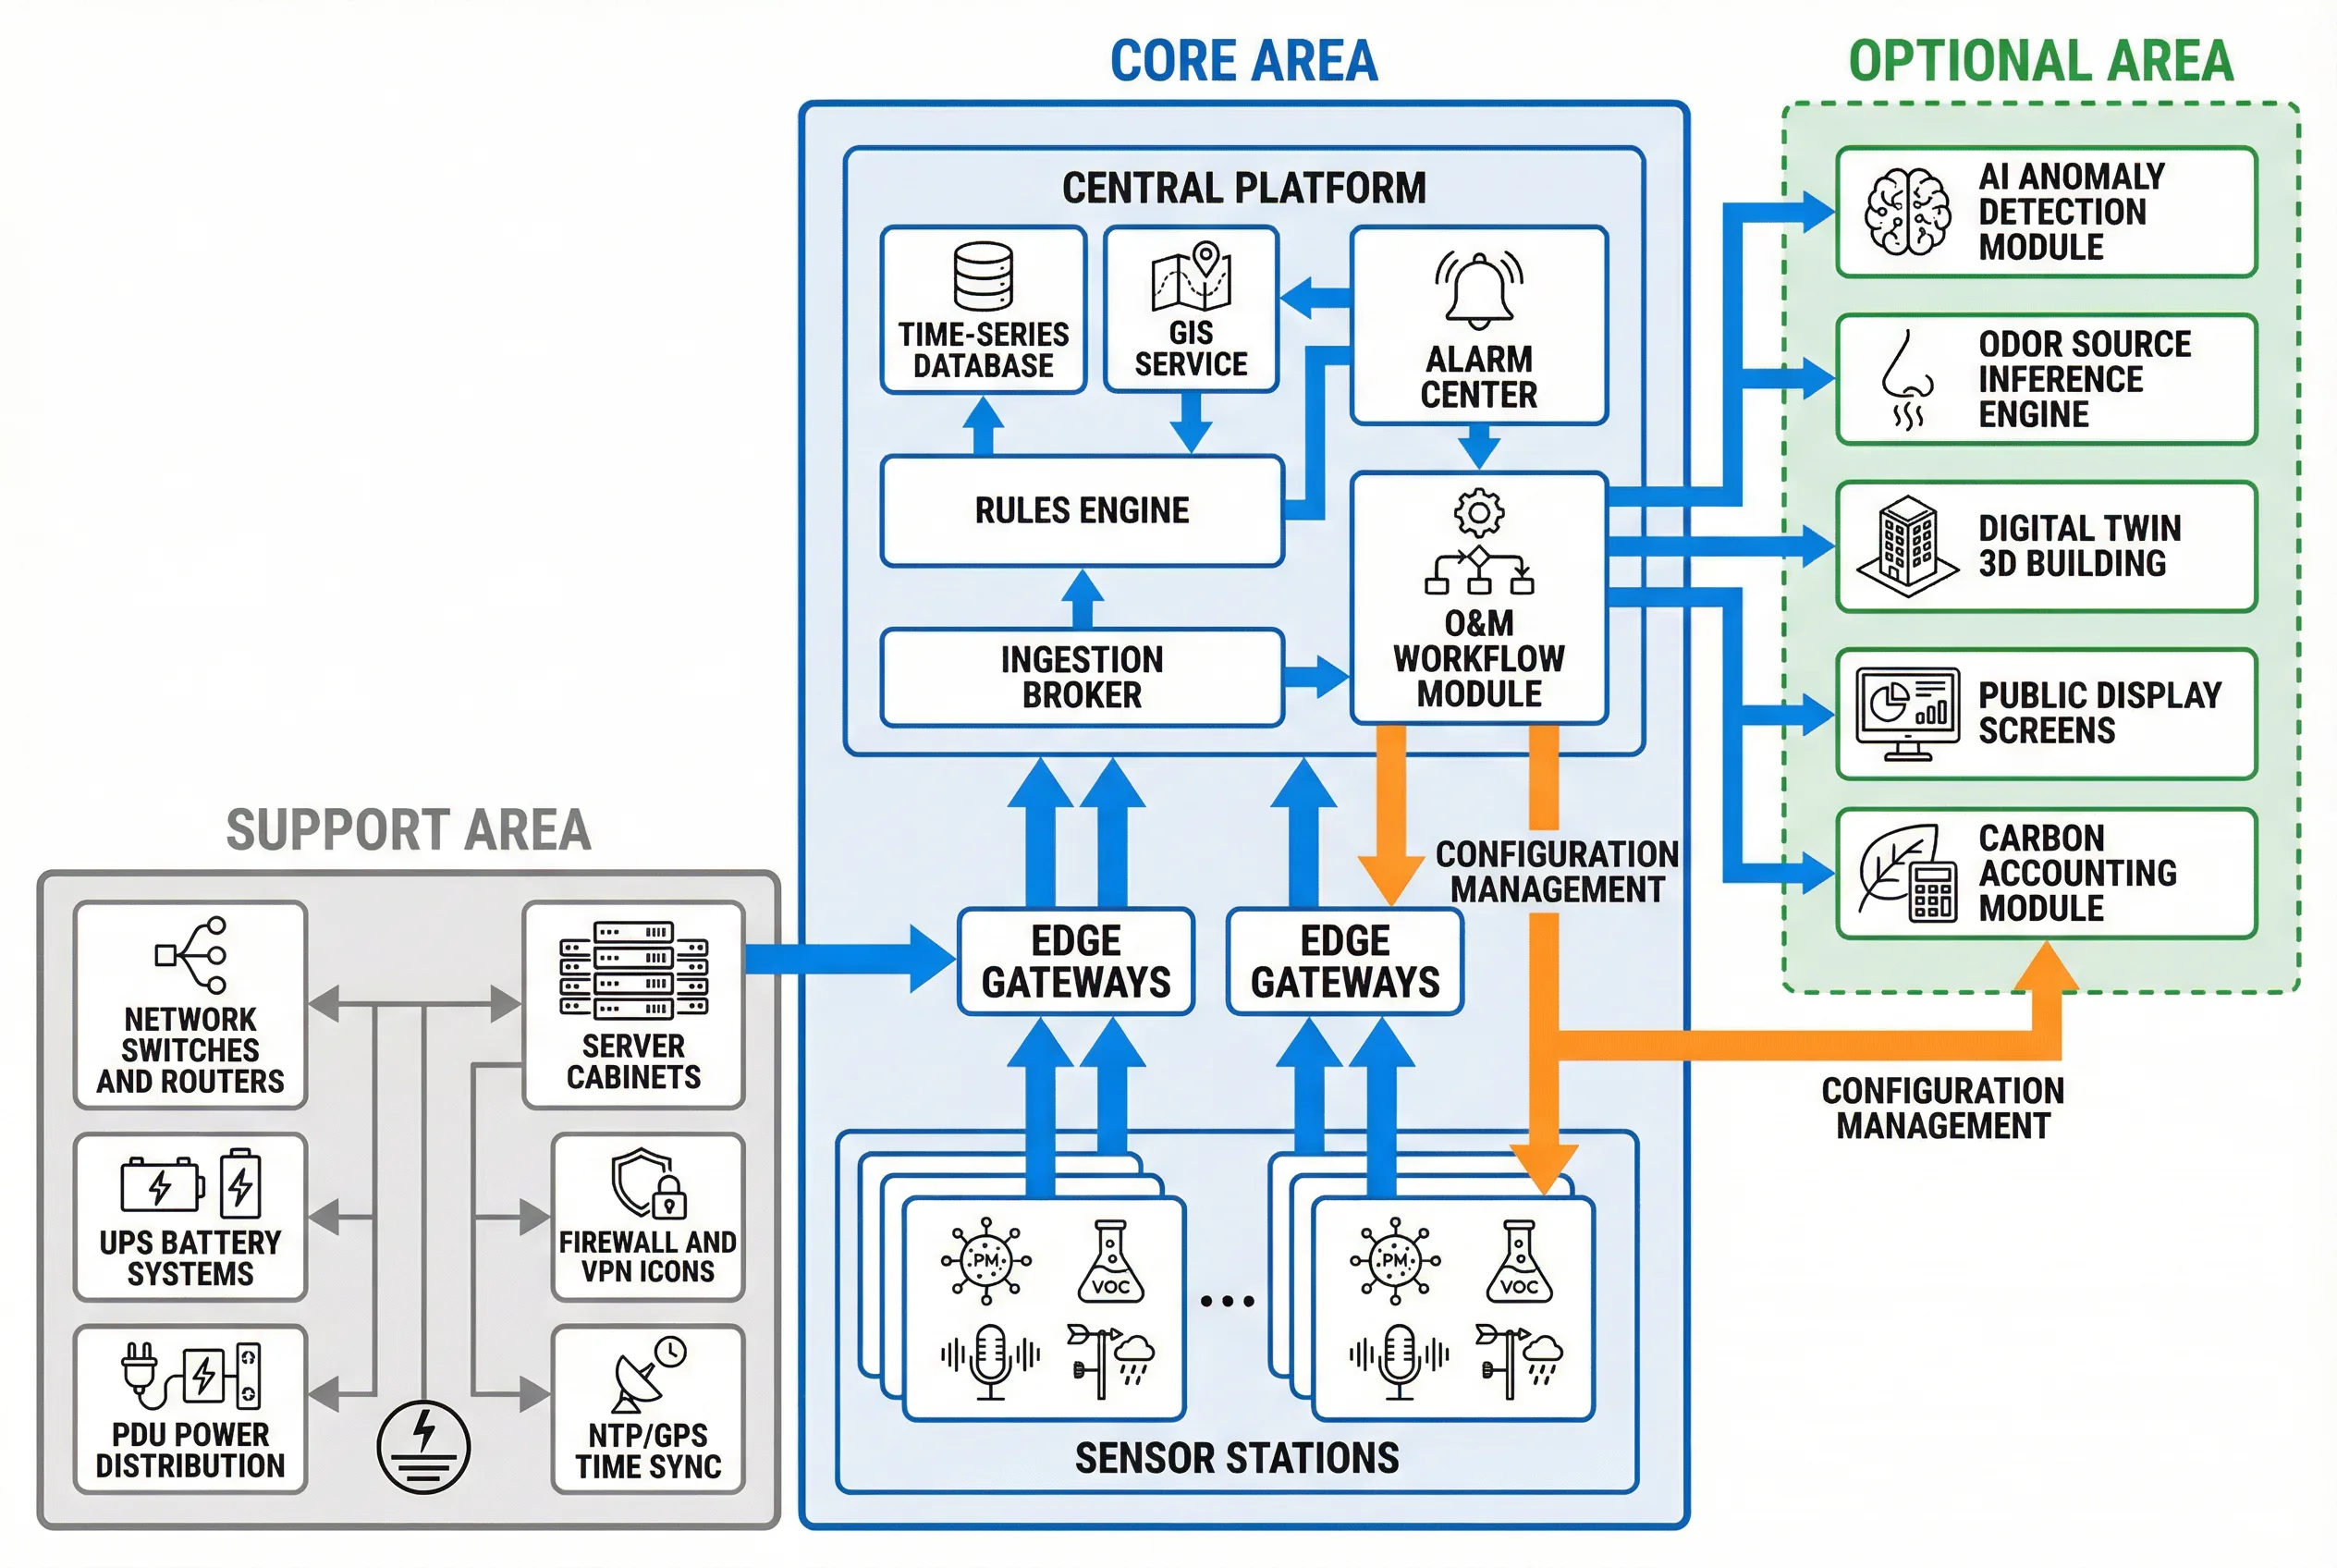
Figure 1.1: Layered Component Architecture — Core, Optional, and Support Boundary Zones
Deployment Boundaries
| Boundary | Location | Key Hardware | Primary Function |
|---|---|---|---|
| Field | Poles, rooftops, manholes, fence lines, loading bays | Sensor stations, probes, enclosures, SPDs | Measurement, basic self-diagnostics |
| Zone Edge | Aggregation cabinet or telecom room per zone | Gateway, PoE switch, UPS (optional), surge protection | Protocol mediation, buffering, local rules, uplink management |
| Central | On-prem server room or cloud VPC | Application servers, TSDB, object storage, GIS, firewall | Governance, analytics, reporting, audit, integration |
Data & Control Flow
Data flows from sensors through protocol adapters to the edge buffer, then via secure MQTT/HTTPS transport to the central broker, through stream processing to storage, and finally to API/UI/reporting endpoints. Control flows in the opposite direction: the platform pushes configuration updates including sampling intervals, threshold values, and OTA firmware to the edge, which applies them and logs the changes before the station updates its behavior.
1.2 Components & Functions
The following inventory diagram and component table provide a complete engineering-level description of every major component in the system. Each component entry includes its primary responsibility, input and output specifications, key performance indicators, and the most common mismatch risks encountered during deployment and commissioning.
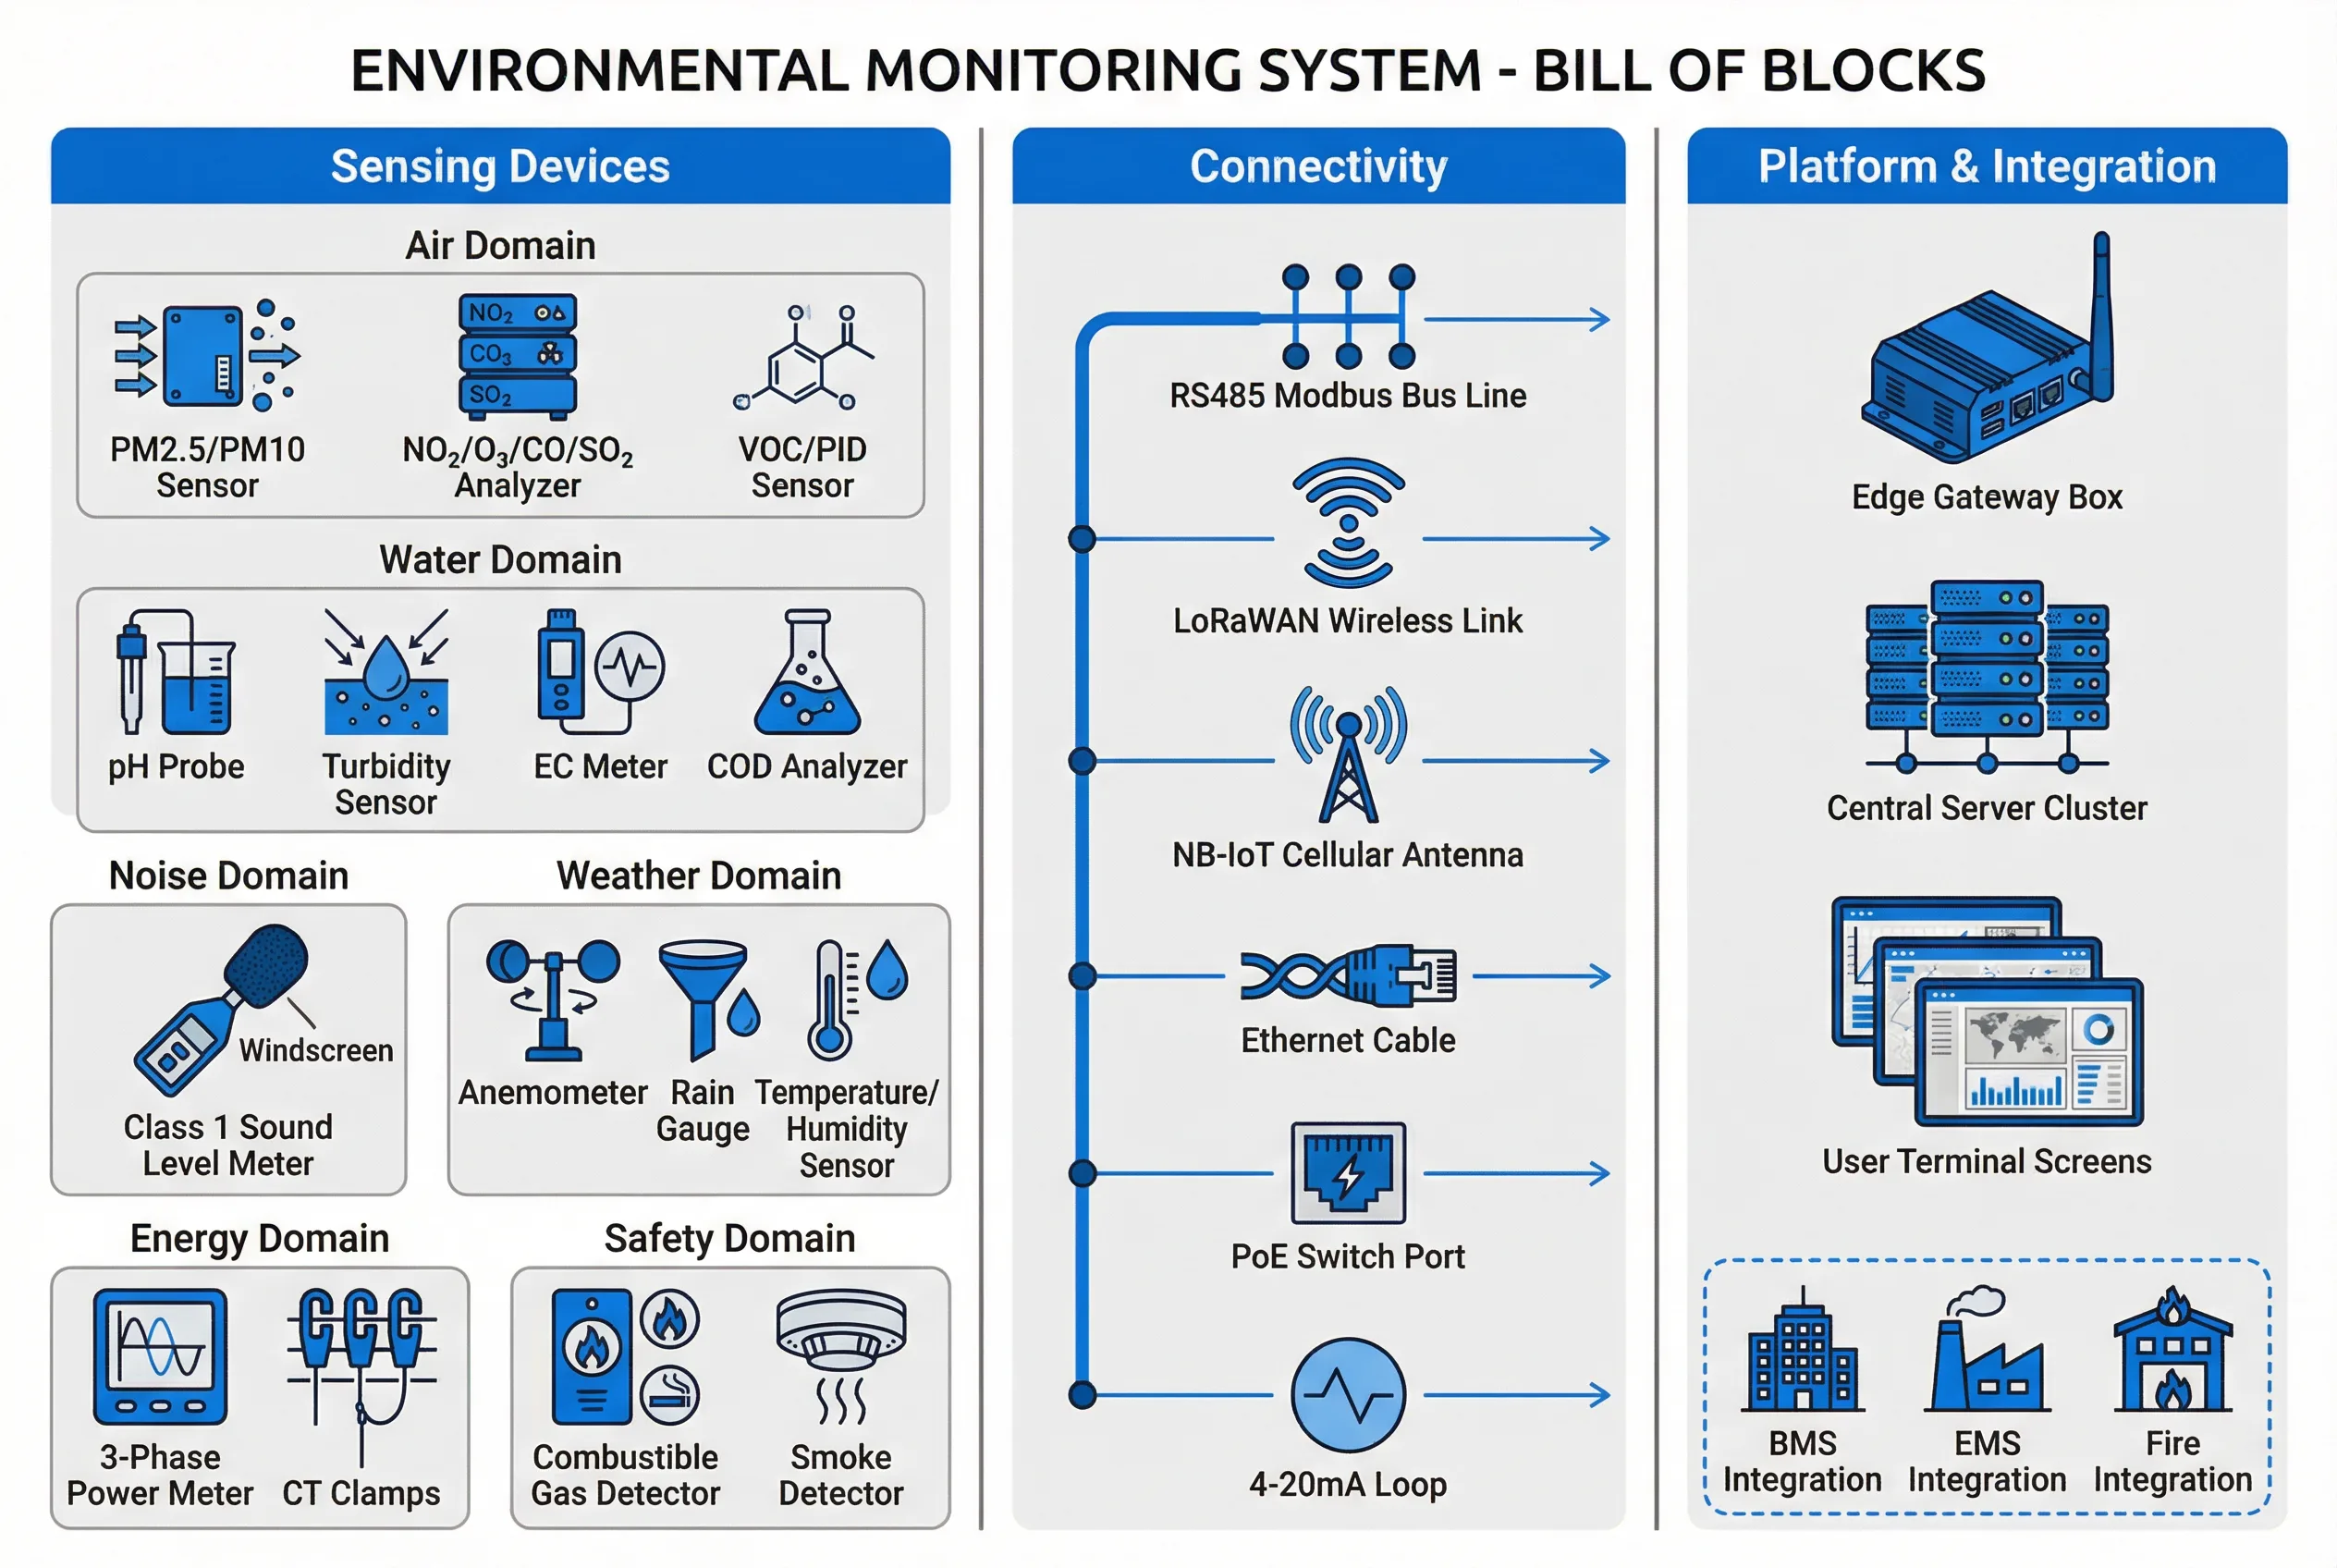
Figure 1.2: Component Inventory Diagram — Sensing Devices, Connectivity, and Platform & Integration Blocks
| Component | Primary Responsibility | Inputs | Outputs | Key KPIs (Typical) | Common Mismatch Risk |
|---|---|---|---|---|---|
| Ambient Air Station (PM/NO₂/O₃/CO/SO₂) | Boundary and roadside ambient monitoring | Sensor signals, meteorological data | 1–5 min averages, QA flags | Data completeness ≥98%, clock drift <2s/day | Wrong inlet height; poor airflow; condensation |
| Dust/PM Hotspot Node | Construction and yard dust event detection | PM sensor, wind data | Event spikes and trend data | Event detection latency <60s | Sensor saturates; wrong filter/heater configuration |
| Odor/VOC Node (PID/metal-oxide) | Odor complaint correlation | TVOC/odor index readings | Rate-of-change alarms | Drift control; false alarm rate KPI | Cross-sensitivity to interferents; no calibration plan |
| Noise Monitor | Boundary noise compliance measurement | SPL microphone signal | Leq/Lmax, spectral data | Class compliance per applicable standard | Windscreen missing; acoustic reflections |
| Weather Station | Dispersion context and safety support | Wind speed/direction, rain, T/RH | 1-min meteorological feed | Wind accuracy per specification | Poor siting; tower turbulence effects |
| Water Discharge Monitor (pH/ORP/EC/Turbidity/COD) | Effluent excursion detection | Probe readings from flow cell | Alarms and compliance reports | Probe health score; cleaning cycle compliance | Fouling; air bubbles; wrong flow cell sizing |
| Energy Meter (3-phase) | Energy monitoring and correlation | CT/PT signals | kWh, demand, power quality data | Accuracy class per specification; time sync | CT ratio mismatch; wiring polarity errors |
| Edge Gateway | Normalize, buffer, local rule execution | Multi-protocol device data | MQTT/HTTPS uplink, local alarms | Buffer ≥7 days; uplink failover <30s | Under-sized CPU/storage for device count |
| Central Platform | Store, analyze, visualize, workflow management | Data streams, configuration events | UI, alarms, reports, APIs | Ingest capacity, retention SLA, RBAC enforcement | Poor schema governance; retention policy gaps |
1.3 Working Principles
Startup Sequence
System startup follows a structured commissioning sequence designed to ensure data quality from the first measurement. The process begins with station commissioning, during which device IDs, geographic coordinates, and channel mappings are registered in the asset inventory. The edge gateway then registers the device, validates time synchronization against the NTP server, and applies the assigned sampling profile. Finally, the platform verifies data continuity and QA flag behavior, enabling alarm rules only after a stabilization window of 30 to 120 minutes depending on the sensor technology — electrochemical sensors require longer warm-up than optical sensors.
Normal Operation
During normal operation, sensors sample at their configured intervals, the edge gateway applies timestamps and plausibility validation, compresses and forwards data via secure transport, the platform stores and evaluates the data against rule sets, alarms notify operators and create work tickets, and O&M staff close tickets with on-site verification evidence. This closed loop ensures that every anomaly is tracked from detection to resolution.