Scenarios & Selection
Eight detailed deployment scenarios with real-scene imagery, technical requirements, success metrics, and a comprehensive solution mapping matrix to guide architecture selection for any park type.
3.1 Applicability Boundaries
The smart campus environmental monitoring system is applicable when a multi-tenant park requires a unified view across air, water, noise, weather, and energy domains; when audit-ready historical data is needed for compliance evidence; and when cross-system alarm linkage is required to coordinate EHS, property management, and operations teams. The system is specifically designed for parks with mixed indoor/outdoor areas and multiple stakeholder groups with different data access requirements.
Key deployment constraints include outdoor vandalism risk requiring anti-tamper mounting, lightning and surge exposure requiring multi-level SPD, network coverage gaps requiring LoRa or cellular fallback, probe fouling at water discharge points requiring planned maintenance, seasonal humidity extremes requiring IP65+ enclosures with breathable membranes, limited O&M staff requiring remote diagnostics and OTA management, and procurement lead times requiring approved alternate suppliers.
3.2 Typical Deployment Scenarios
Scenario 1 — Industrial Boundary Compliance (Dust / Noise / Odor)
Recommended Architecture: Standard / Advanced | Connectivity: Fiber + LoRa/NB-IoT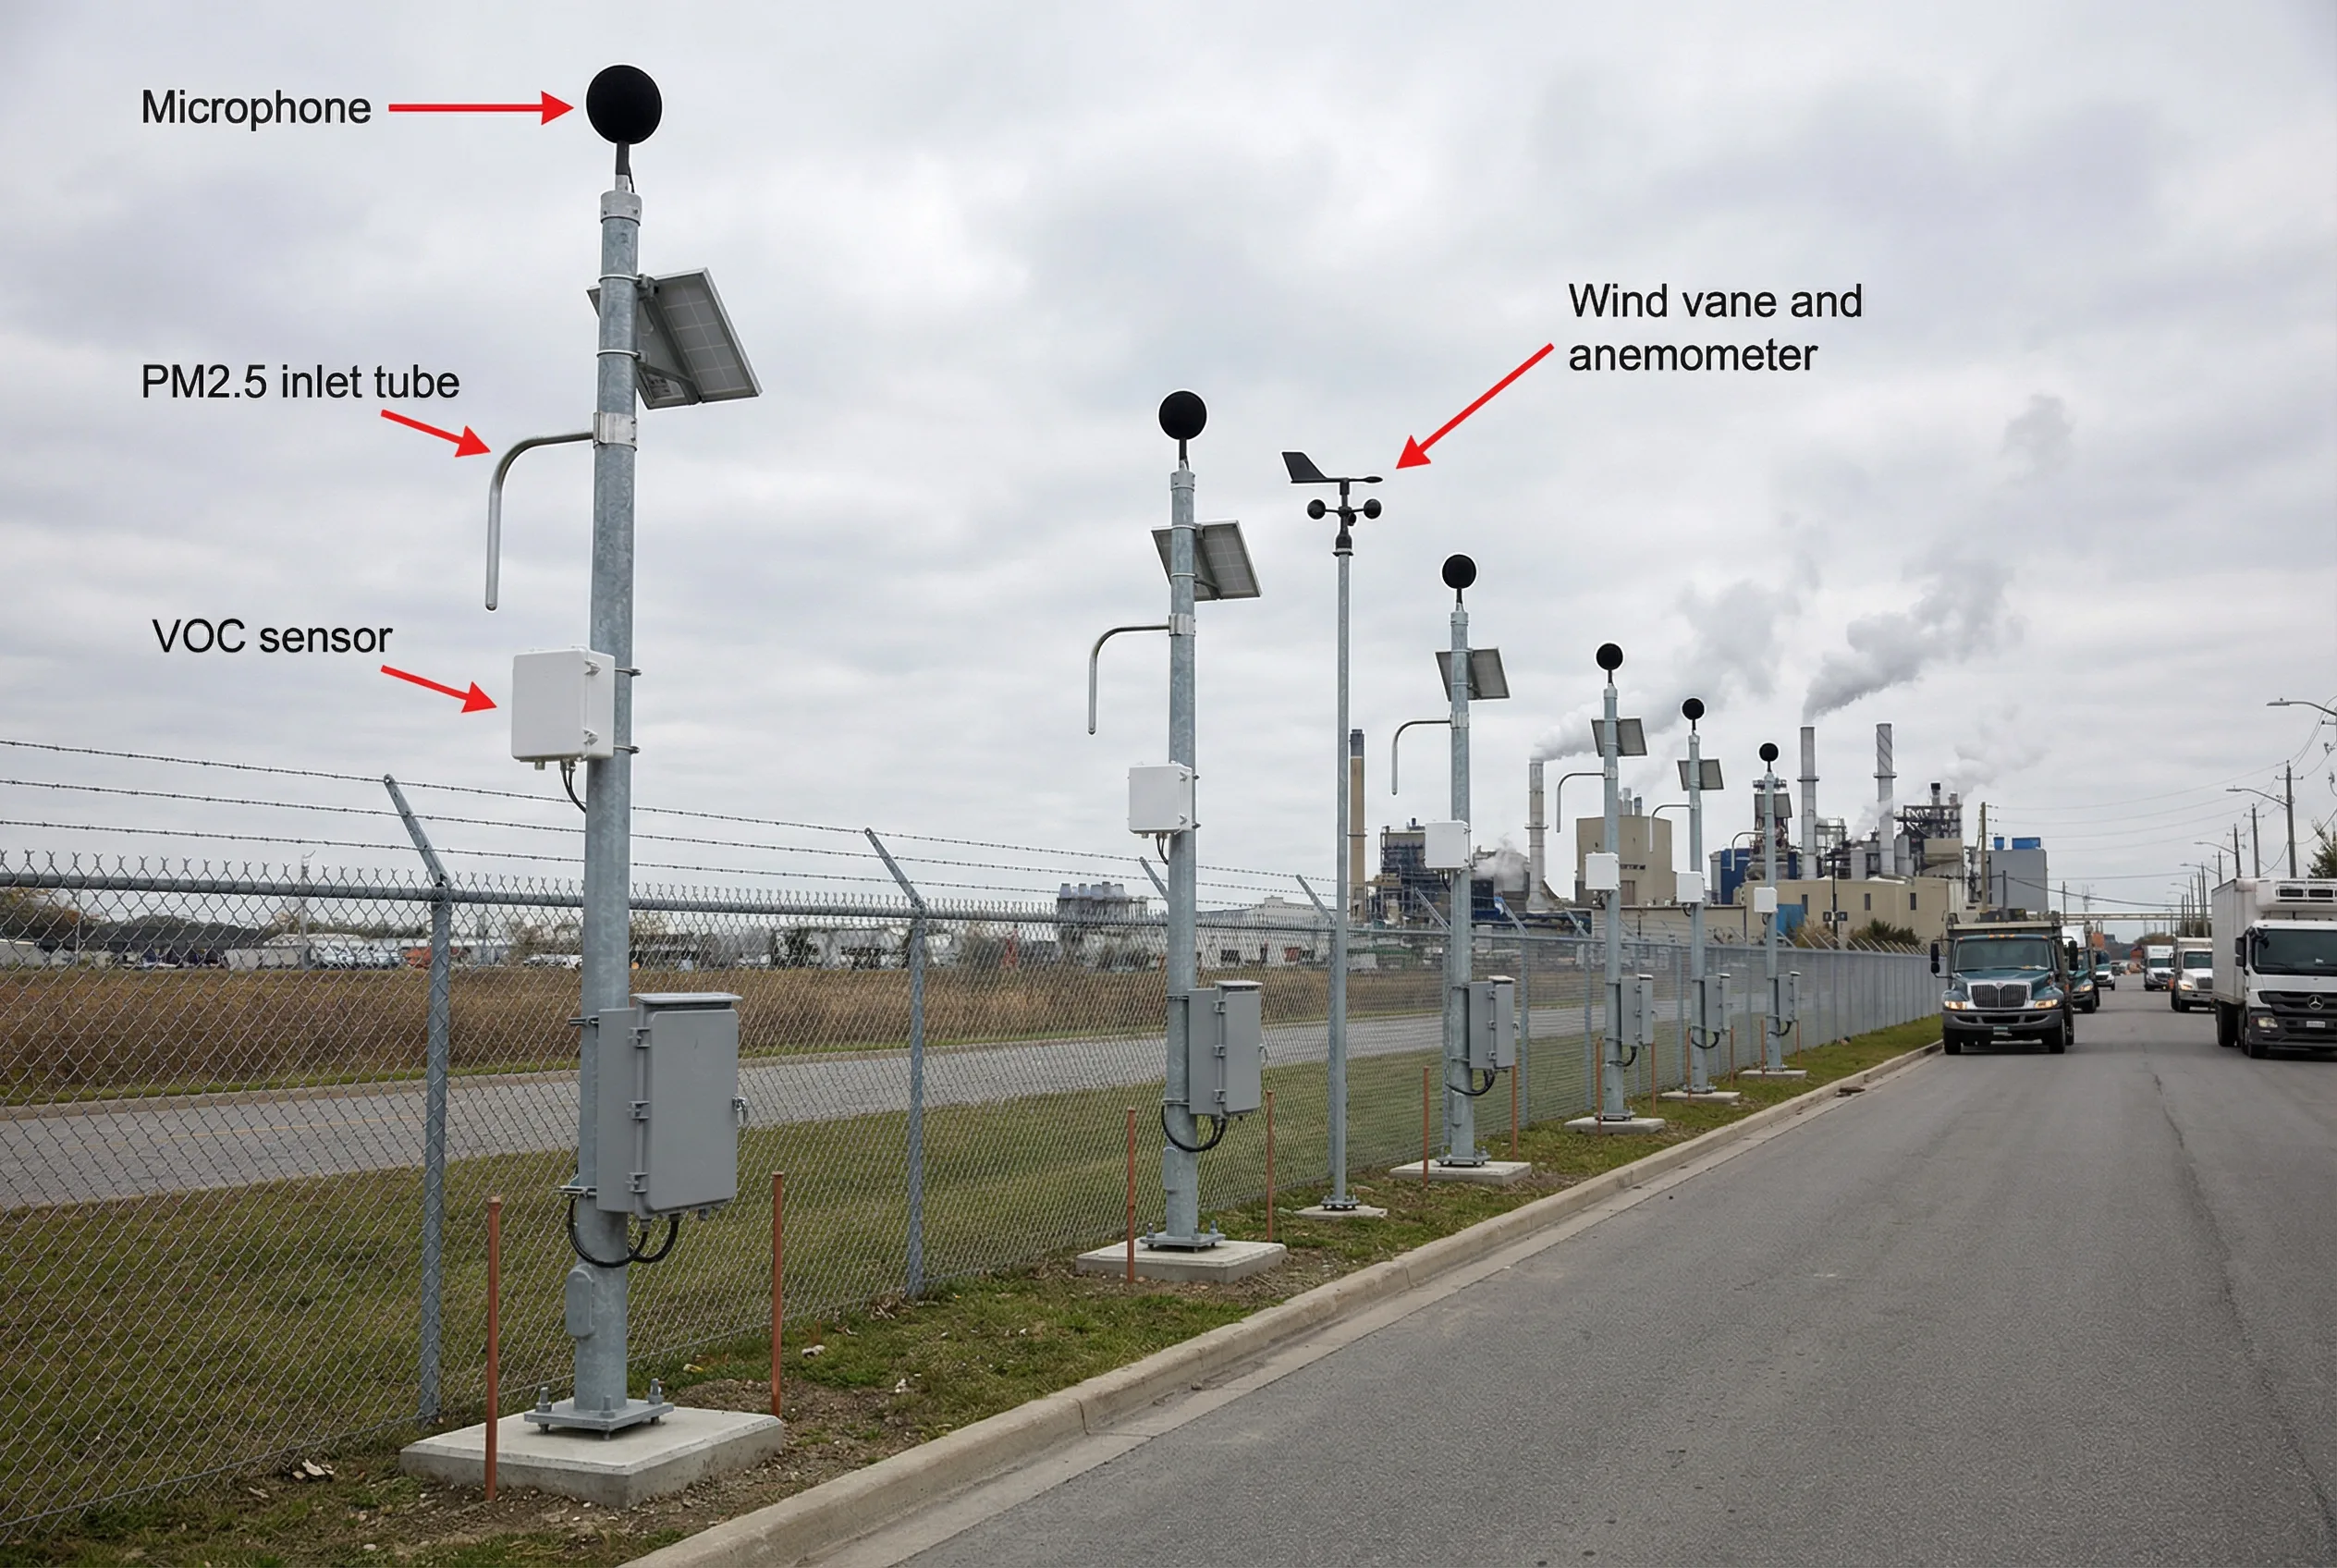
Industrial boundary monitoring is fundamentally about producing defensible evidence that withstands regulatory scrutiny and complaint investigation. Sensor siting must strictly follow height and clearance rules to avoid turbulence, reflections, and obstruction effects that would compromise measurement validity. Audits demand data integrity, which requires continuous QA flag monitoring, calibration records, and tamper-evident evidence packaging.
Complaints and compliance requirements frequently overlap at the boundary, making correlation with wind direction data essential for attributing excursions to specific sources. Nighttime operations introduce additional challenges: stable power supply, secure enclosures to prevent vandalism, and reliable network connectivity when maintenance staff are not on-site.
The boundary monitoring network must be designed for long-term unattended operation with remote diagnostics capability. Each pole station should include local storage and local alarming to ensure continuity during network outages, which are common in outdoor industrial environments.
| Requirement Category | Specification |
|---|---|
| Noise measurement | Class 1 or Class 2 sound level meter with windscreen; Leq/Lmax at 1-min intervals |
| PM event detection | PM2.5/PM10 with <60s event detection latency; rate-of-change alarm |
| VOC/odor trending | PID or metal-oxide sensor; odor index correlation with complaint records |
| Meteorological data | Wind speed/direction, temperature, humidity at each boundary point |
| Data integrity | TLS transport, integrity hash, WORM archive for compliance evidence |
| Vandal protection | Anti-tamper bolts, tamper switch alarm, cable conduits, secure cabinet |
| Remote diagnostics | Device heartbeat, signal strength, battery/power status monitoring |
| Data retention | Hot 90 days, warm 1 year, cold archive ≥5 years for audit evidence |
Scenario 2 — Construction Dust Control in Tech Park
Recommended Architecture: Basic / Standard | Connectivity: LoRaWAN + 4G, Battery/Solar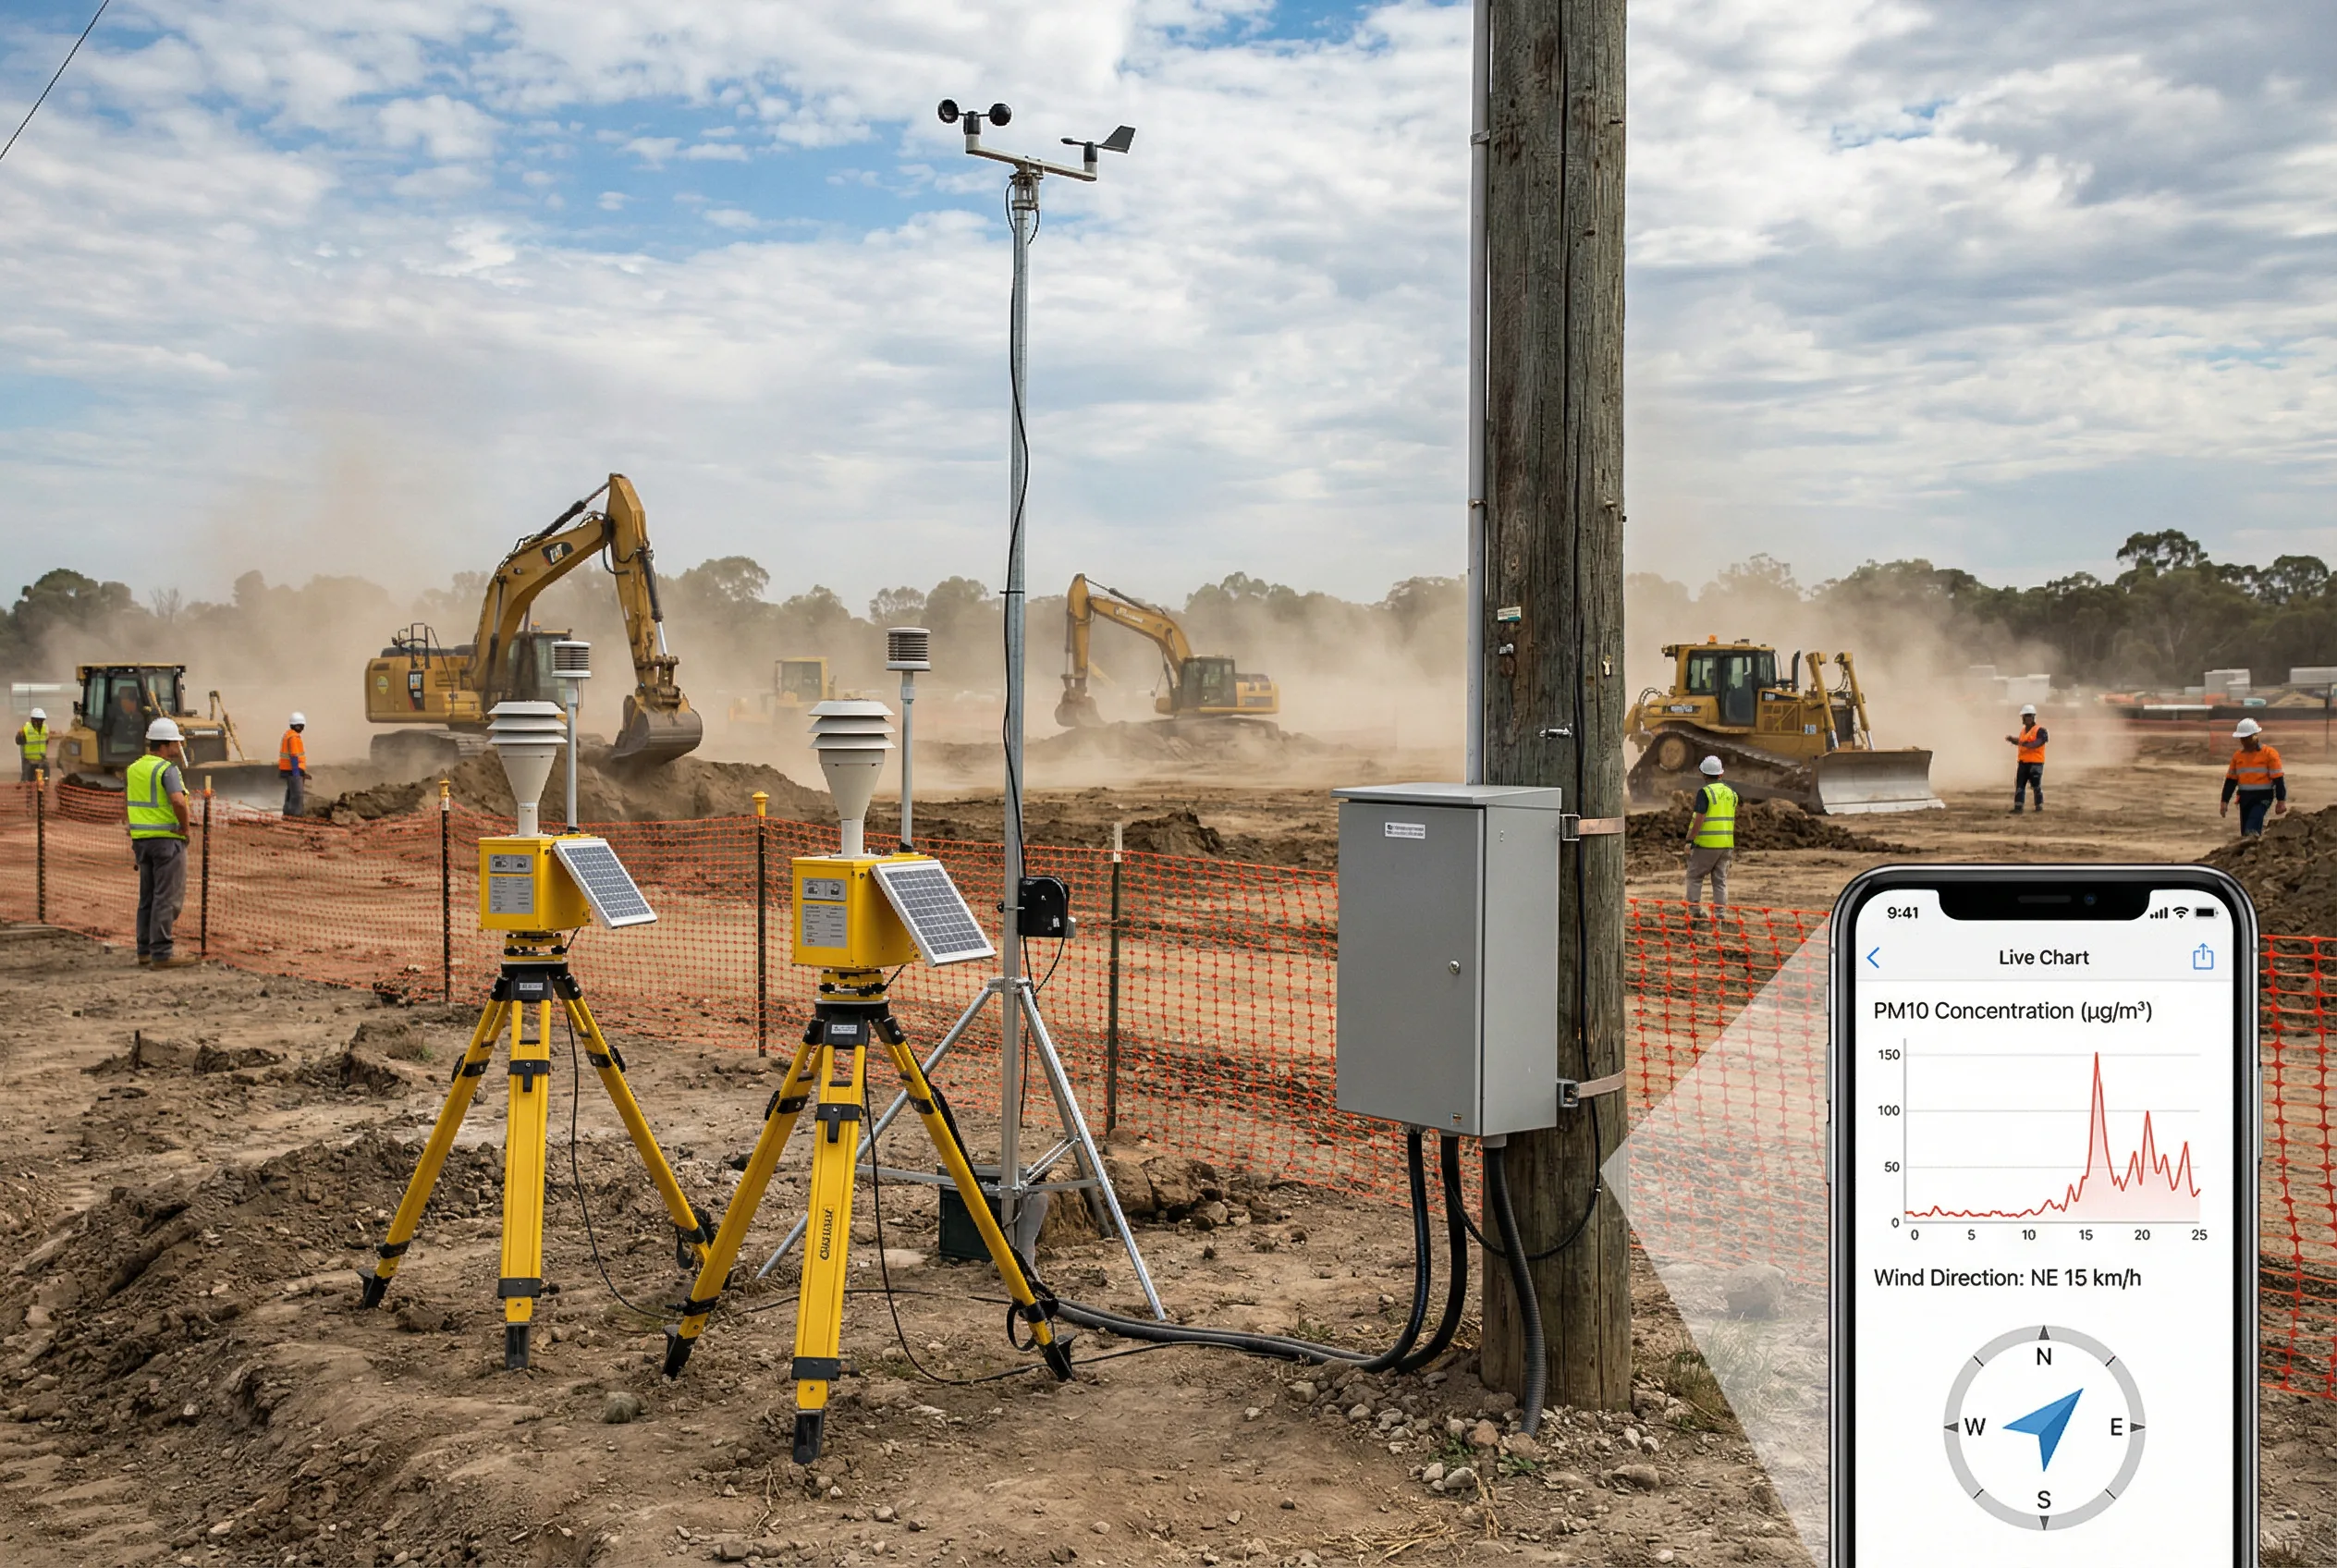
Construction dust spikes are characteristically short-duration and highly localized, requiring high-frequency PM sampling and rate-of-change alarm logic to detect events within one minute of onset. Network infrastructure at construction sites is typically temporary, making battery-powered or solar-assisted nodes with LoRa connectivity to a gateway the preferred architecture. Devices must be designed for rapid redeployment as construction zones shift.
Frequent relocation demands standardized mounting systems — typically tripod or clamp mounts — and quick-configuration workflows that allow a new node to be commissioned in under 30 minutes. Geofenced alert zones should be configured to automatically notify site managers and EHS officers when PM thresholds are exceeded within the construction boundary.
Daily compliance reports should be auto-generated and distributed to project managers and regulatory contacts, documenting peak PM events, wind conditions, and any mitigation actions taken. The system provides measurable evidence that dust suppression measures — water spraying, wheel wash, barrier installation — are effective.
| Requirement Category | Specification |
|---|---|
| Portable mounting | Tripod or quick-clamp mount; relocation <30 min per node |
| High-frequency PM | 1-min sampling interval; PM2.5/PM10 with rate-of-change alarm |
| Power | Battery + solar panel; ≥7 days battery backup in low-irradiance conditions |
| Connectivity | LoRaWAN to gateway; 4G fallback for gateway uplink |
| Geofenced alerts | Zone-based alarm routing to site manager and EHS officer |
| Rugged IP rating | IP65 minimum; vibration-resistant mounting |
| Quick calibration | Factory-calibrated with field verification procedure <15 min |
| Daily reports | Auto-generated PDF with peak events, wind data, and mitigation log |
Scenario 3 — Campus Indoor Comfort & Complaint Governance
Recommended Architecture: Standard | Connectivity: Ethernet/PoE/Wi-Fi
Indoor environmental quality issues are fundamentally about occupant comfort, productivity, and health. In multi-tenant office and campus buildings, disputes about indoor air quality require transparent, independently verifiable records to resolve fairly. Sensor density must balance measurement coverage against installation and maintenance cost, typically targeting one node per 100–200 m² in occupied zones.
Integration with the building management system enables root cause identification when CO₂ or TVOC levels rise — distinguishing between occupancy-driven increases and HVAC system failures. Floor-level heatmaps provide facility managers with an intuitive view of comfort distribution across the building, enabling targeted interventions rather than blanket HVAC adjustments.
Privacy-safe design is essential in occupied spaces: sensors should measure only environmental parameters and must not include audio or video capabilities. Role-based access control ensures that individual floor data is accessible to the relevant tenant manager while building-wide views are available to the facility team.
| Parameter | Threshold / Target | Alarm Level |
|---|---|---|
| CO₂ concentration | <1000 ppm (occupied); <800 ppm (preferred) | Warning at 1000 ppm; Critical at 1500 ppm |
| TVOC | <300 µg/m³ (TVOC index) | Warning at 300; Critical at 500 |
| PM2.5 indoor | <25 µg/m³ (24h average) | Warning at 25; Critical at 50 |
| Temperature | 20–26°C (occupied hours) | Outside range for >30 min |
| Relative humidity | 40–60% RH | Below 30% or above 70% |
| Comfort index | Target ≥80/100 | Below 60 triggers HVAC ticket |
Scenario 4 — Logistics Yard: Noise + Exhaust + Safety Gas
Recommended Architecture: Standard / Advanced | Connectivity: Dual Uplink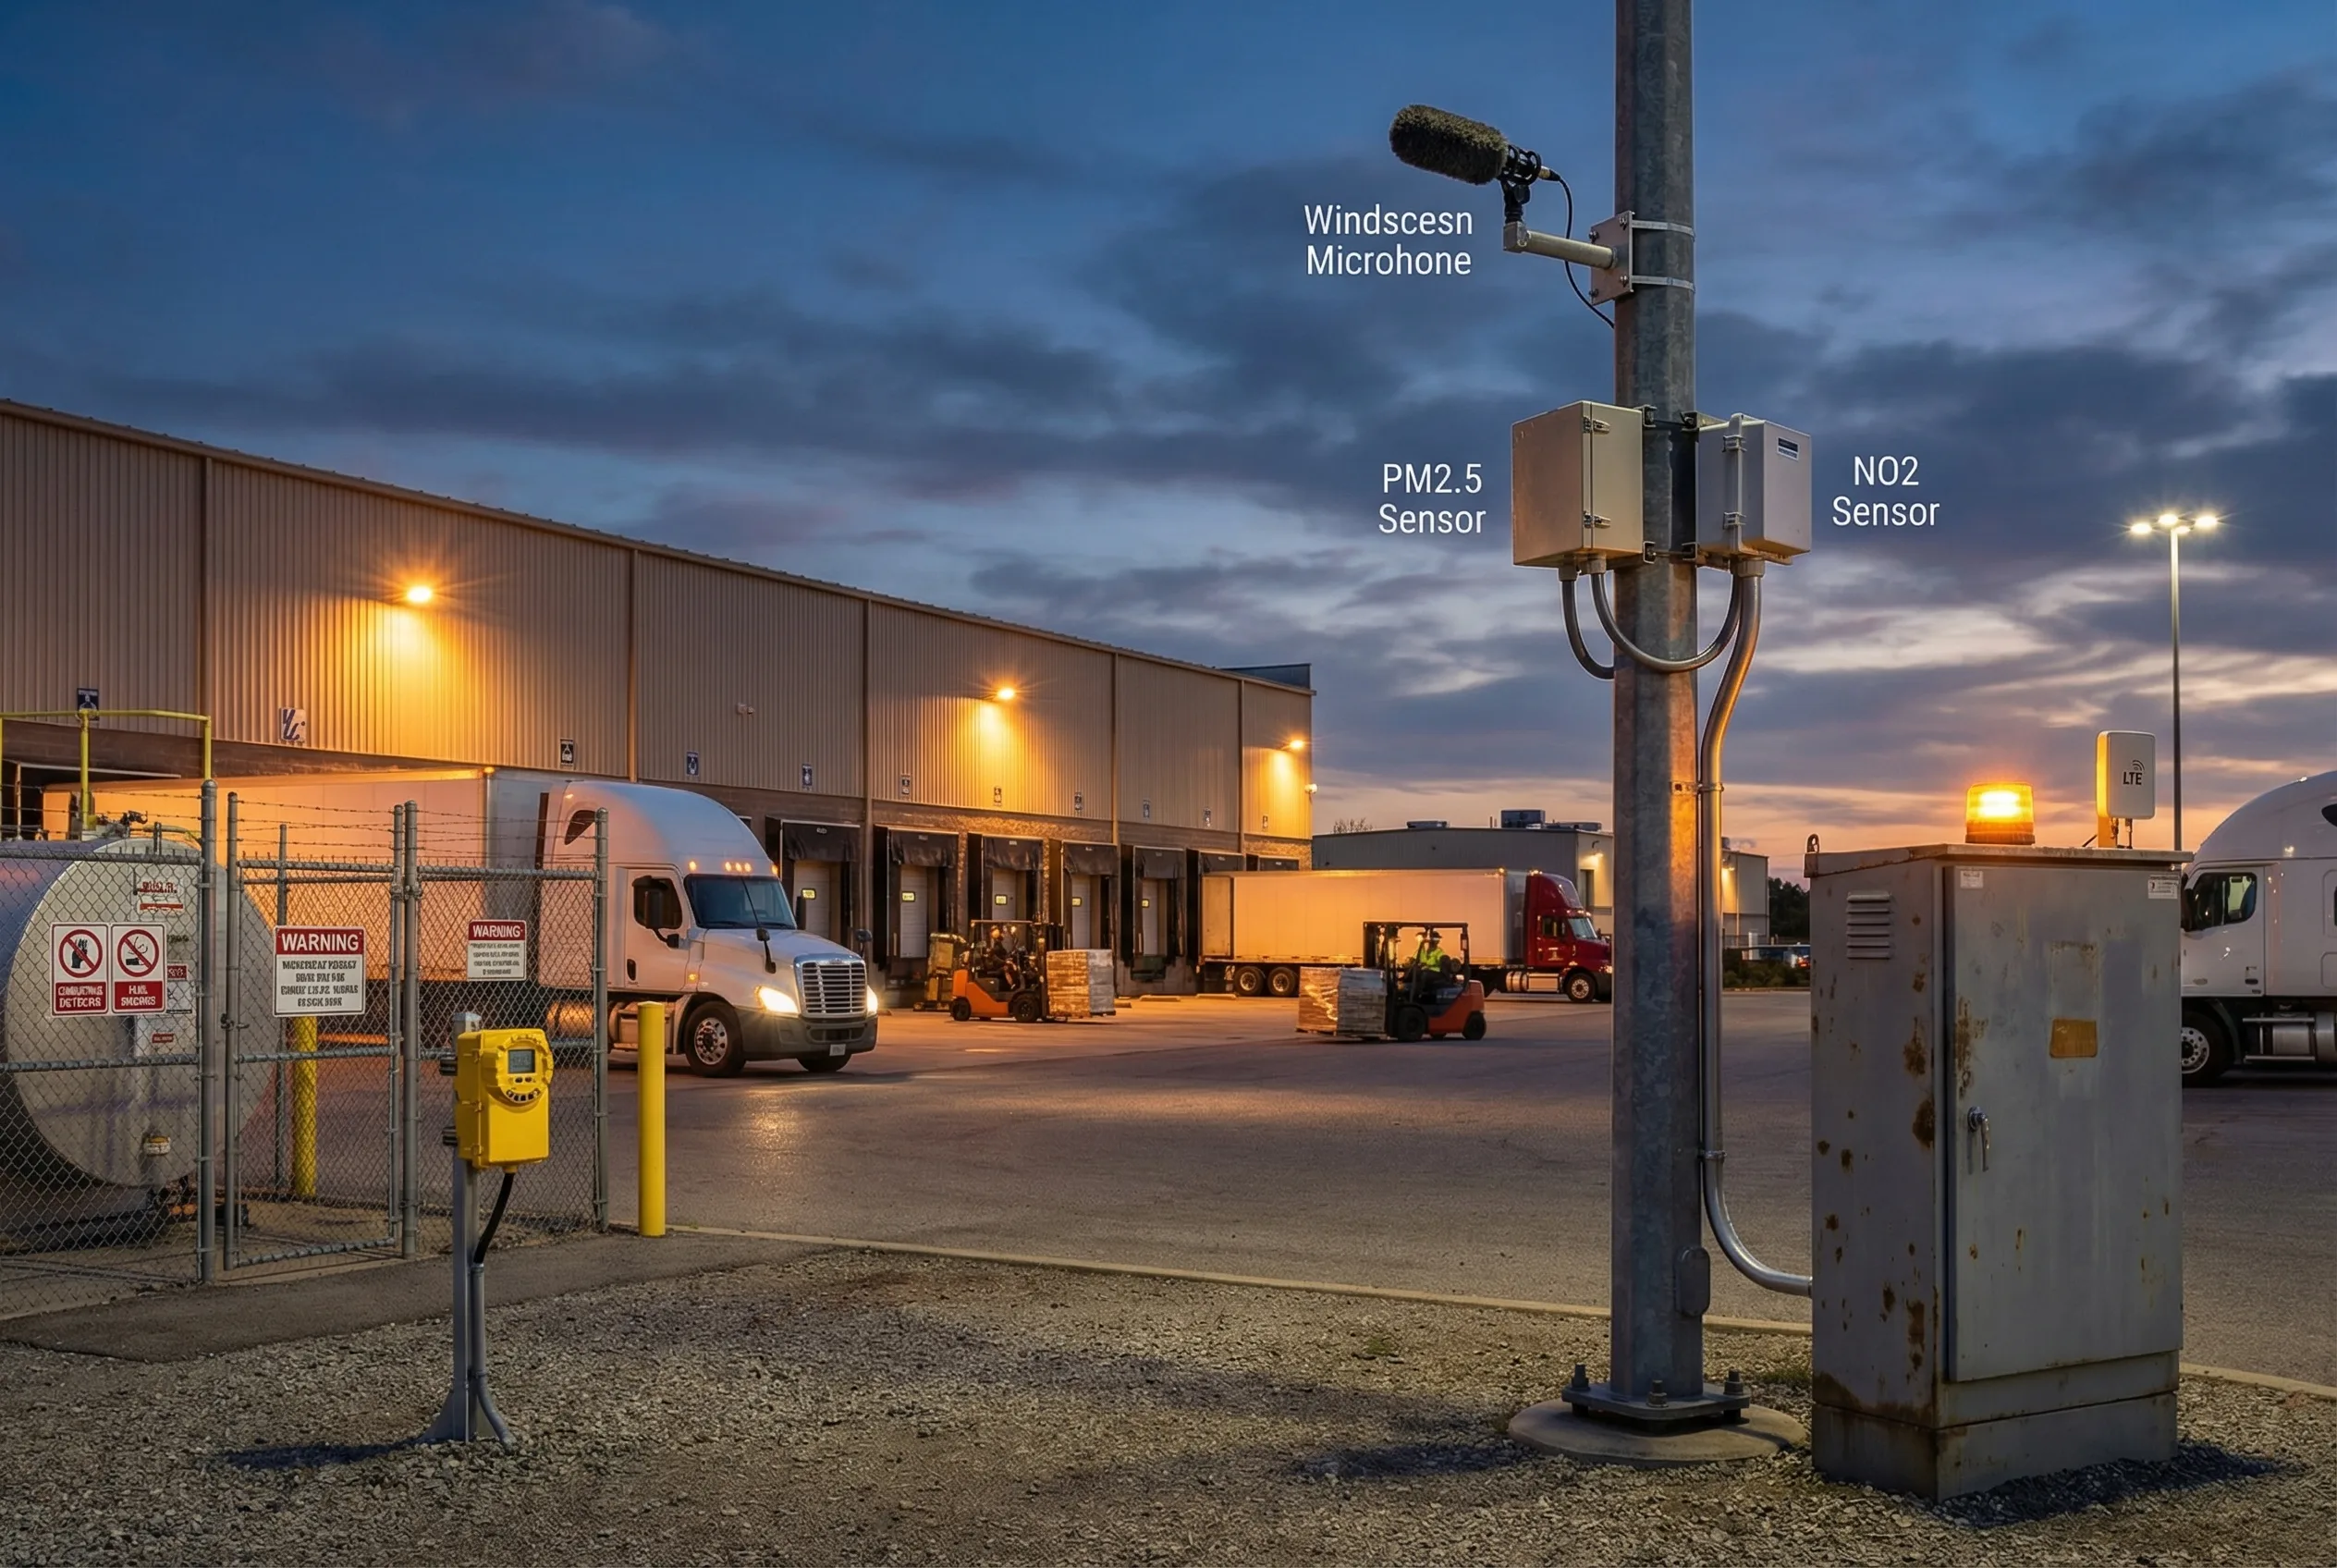
Logistics yards present a challenging combination of noise, air quality, and safety monitoring requirements in a harsh operational environment. Truck peaks during loading and unloading generate both noise excursions and PM/NO₂ spikes that must be correlated with vehicle activity logs to identify root causes and evaluate mitigation effectiveness. Safety sensors near fuel storage areas may be safety-critical, requiring local alarming with redundant notification paths.
The harsh environment — vibration from heavy vehicles, dust from unpaved areas, and temperature extremes — demands ruggedized sensor enclosures and mounting systems designed to withstand mechanical stress. Night operations require stable power supply and secure mounting to prevent tampering, along with local beacon lights that provide visible alarm indication without relying on network connectivity.
Dual uplink configuration is particularly important in logistics yards where network reliability may be lower than in office environments. The edge gateway must maintain local alarming capability even during complete network outages, ensuring that safety-critical gas alarms reach on-site personnel through local relay outputs and beacon lights.
| Sensor Type | Location | Key Specification |
|---|---|---|
| Noise monitor | Boundary fence, downwind of loading bays | Class 2 minimum; Leq 1-min; windscreen required |
| PM2.5/PM10 | Near truck idling zones and unpaved areas | High dynamic range; rate-of-change alarm <60s |
| NO₂ sensor | Near loading dock exhaust zones | Electrochemical; temperature-compensated |
| Combustible gas | Near fuel storage, within 1m of potential leak points | Catalytic bead or IR; local relay output; SIL consideration |
| Edge gateway | Rugged cabinet at yard boundary | IP65, -20 to +60°C, dual uplink, local relay for beacon |
Scenario 5 — Wastewater Discharge Point Monitoring
Recommended Architecture: Standard | Connectivity: 4G/NB-IoT + RS485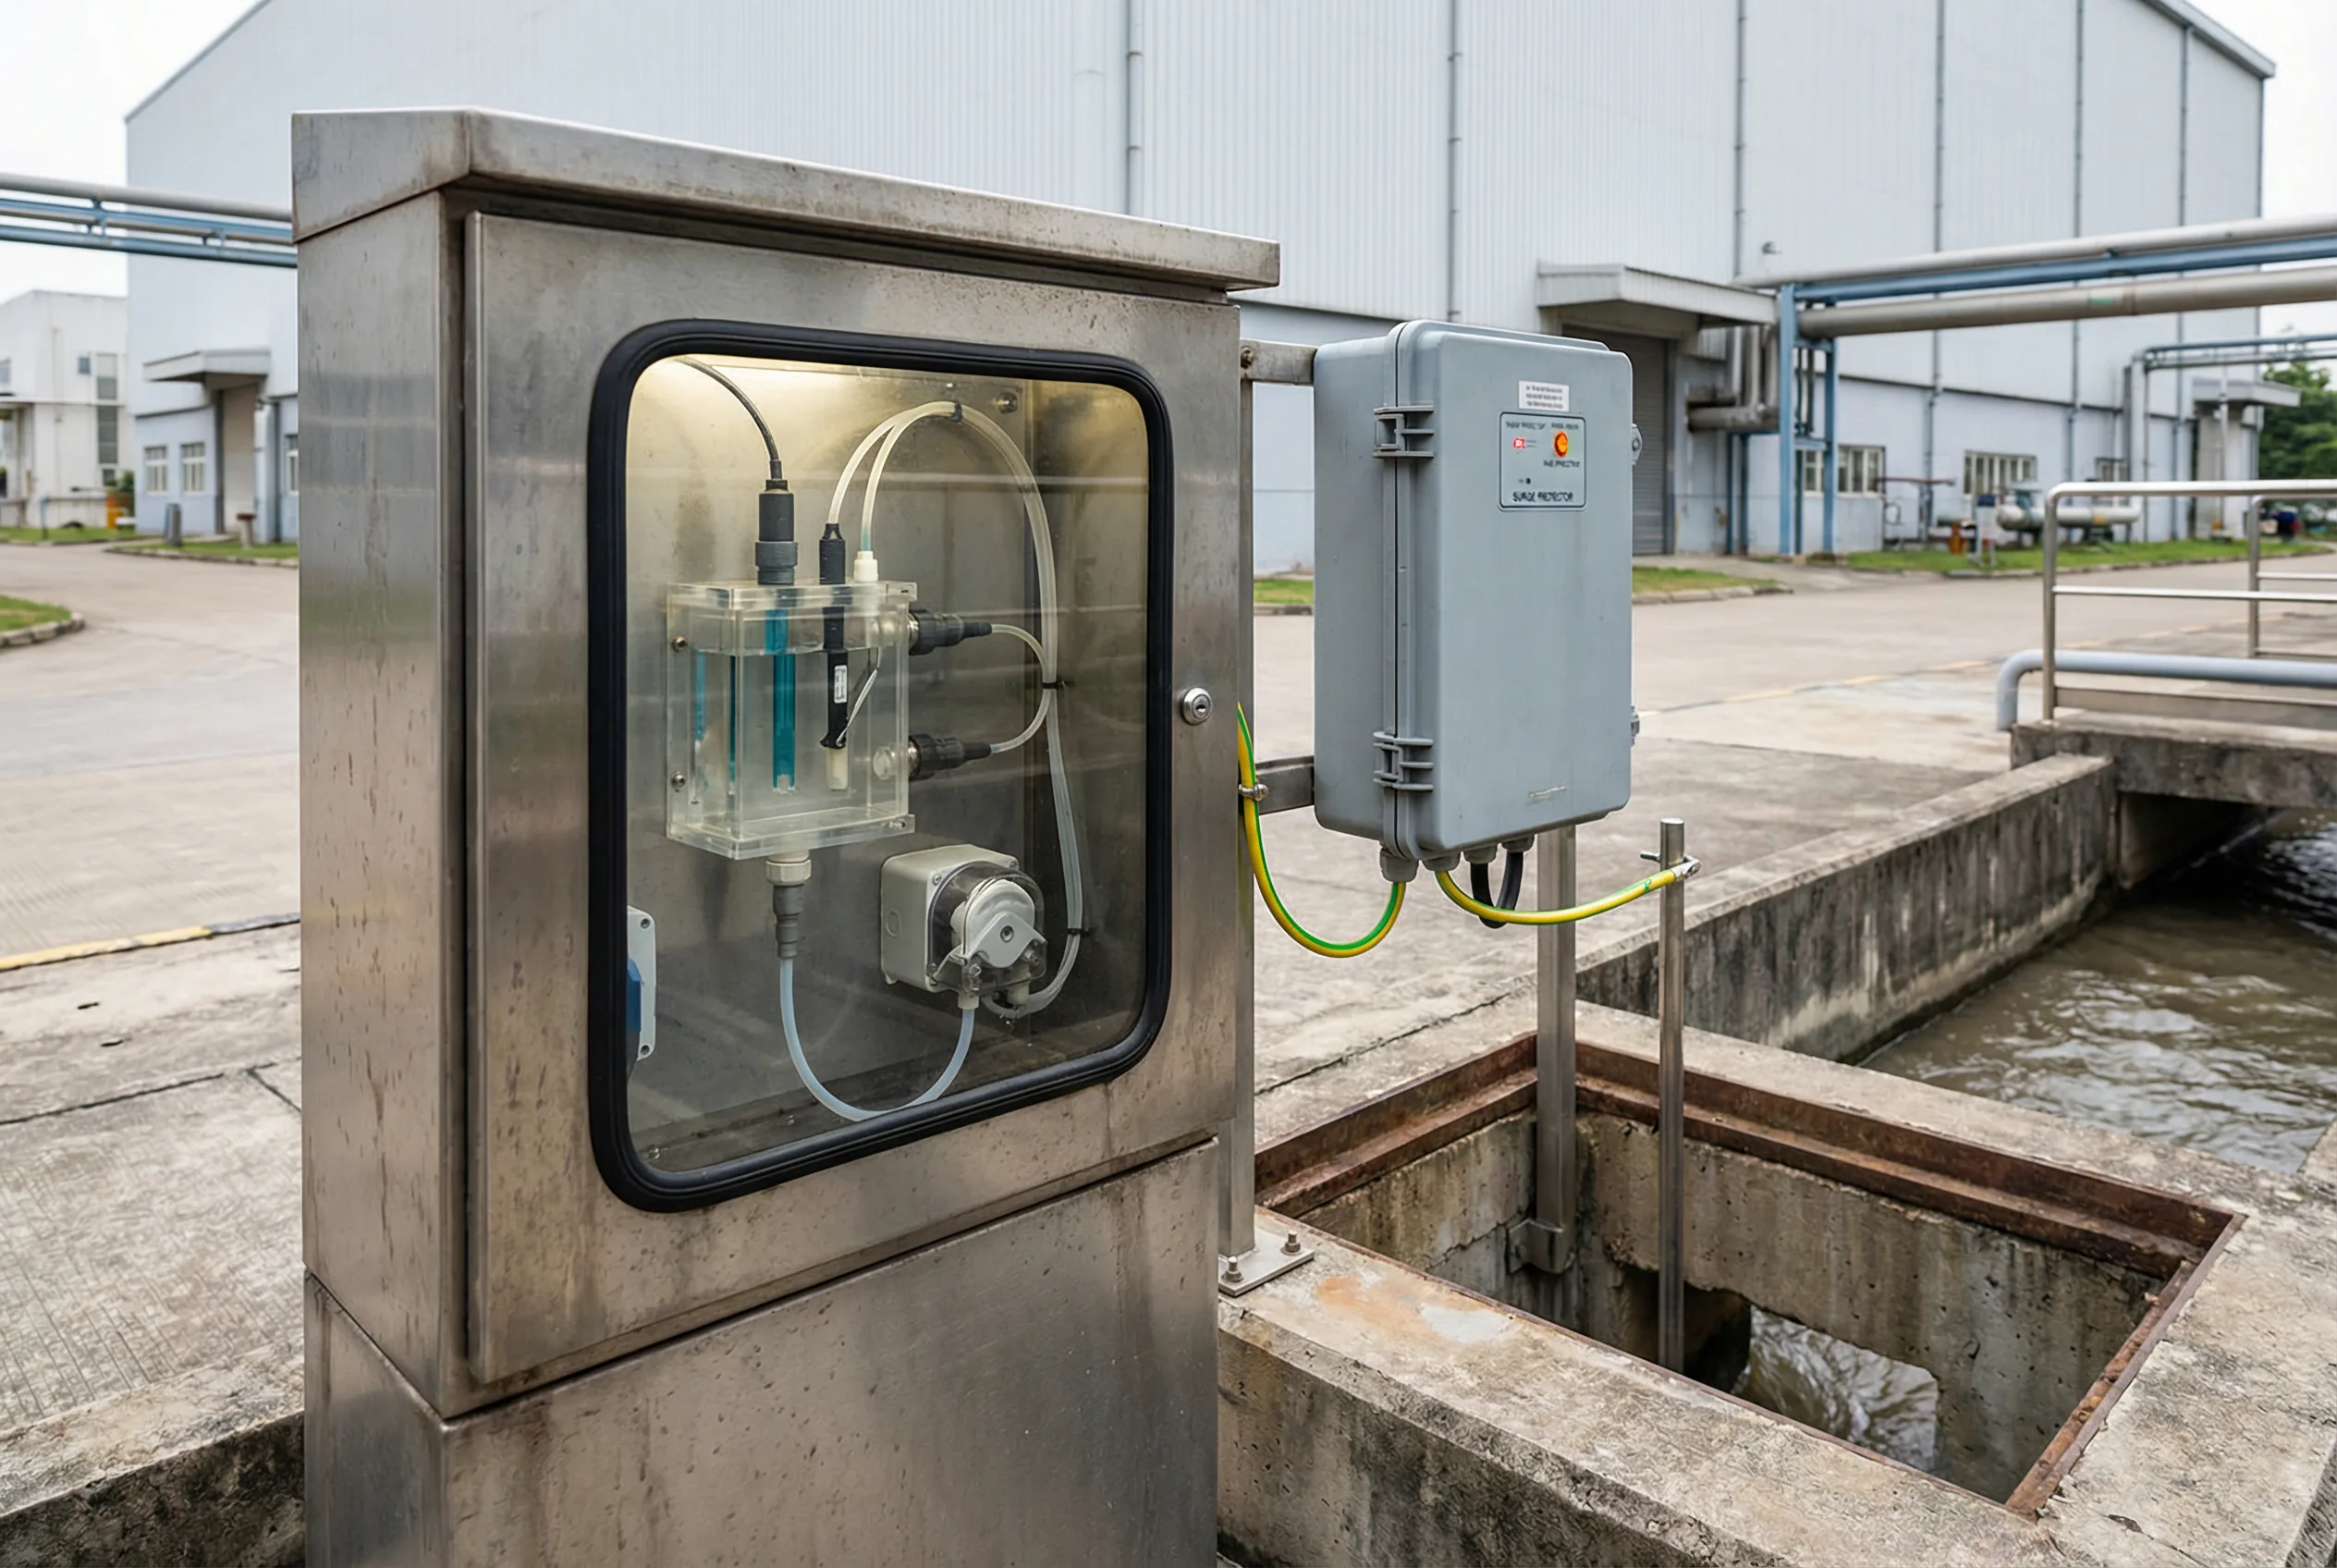
Water quality probes at discharge points are subject to fouling from suspended solids, biological growth, and chemical deposits that cause measurement drift and false excursions if not managed through a rigorous maintenance plan. The maintenance plan — including cleaning frequency, reagent replacement, and calibration schedule — is as important as the sensor selection itself. Evidence must be traceable and aligned with discharge schedules to demonstrate compliance during regulatory inspections.
Edge buffering is particularly critical at discharge points, which are often located in remote areas of the park with unreliable network connectivity. The edge gateway must buffer at least seven days of data and maintain local alarming capability to ensure that discharge excursions are detected and responded to even during network outages. Probe health monitoring — including response time analysis and noise level tracking — provides early warning of fouling before it causes false alarms.
The sampling cabinet must be designed for safe access by maintenance personnel, with appropriate corrosion-resistant materials, proper ventilation to prevent chemical vapor accumulation, and clear labeling of all components. Anti-fouling design features such as automatic cleaning lines and ultrasonic cleaning can significantly reduce maintenance frequency and improve data quality.
| Parameter | Probe Type | Maintenance Interval | Calibration Frequency |
|---|---|---|---|
| pH | Glass electrode or ISFET | Weekly cleaning | Monthly 2-point calibration |
| Turbidity | Optical nephelometric | Weekly wipe | Monthly with formazin standard |
| Electrical conductivity | Toroidal or 4-electrode | Monthly | Quarterly with KCl solution |
| ORP | Platinum electrode | Weekly cleaning | Monthly with quinhydrone |
| COD (optional) | UV absorption or reagent | Per manufacturer | Per regulation |
Scenario 6 — Park-Wide Meteorology for Emergency Response (Odor/Leak Plume)
Recommended Architecture: Advanced | Connectivity: Fiber + 4G Failover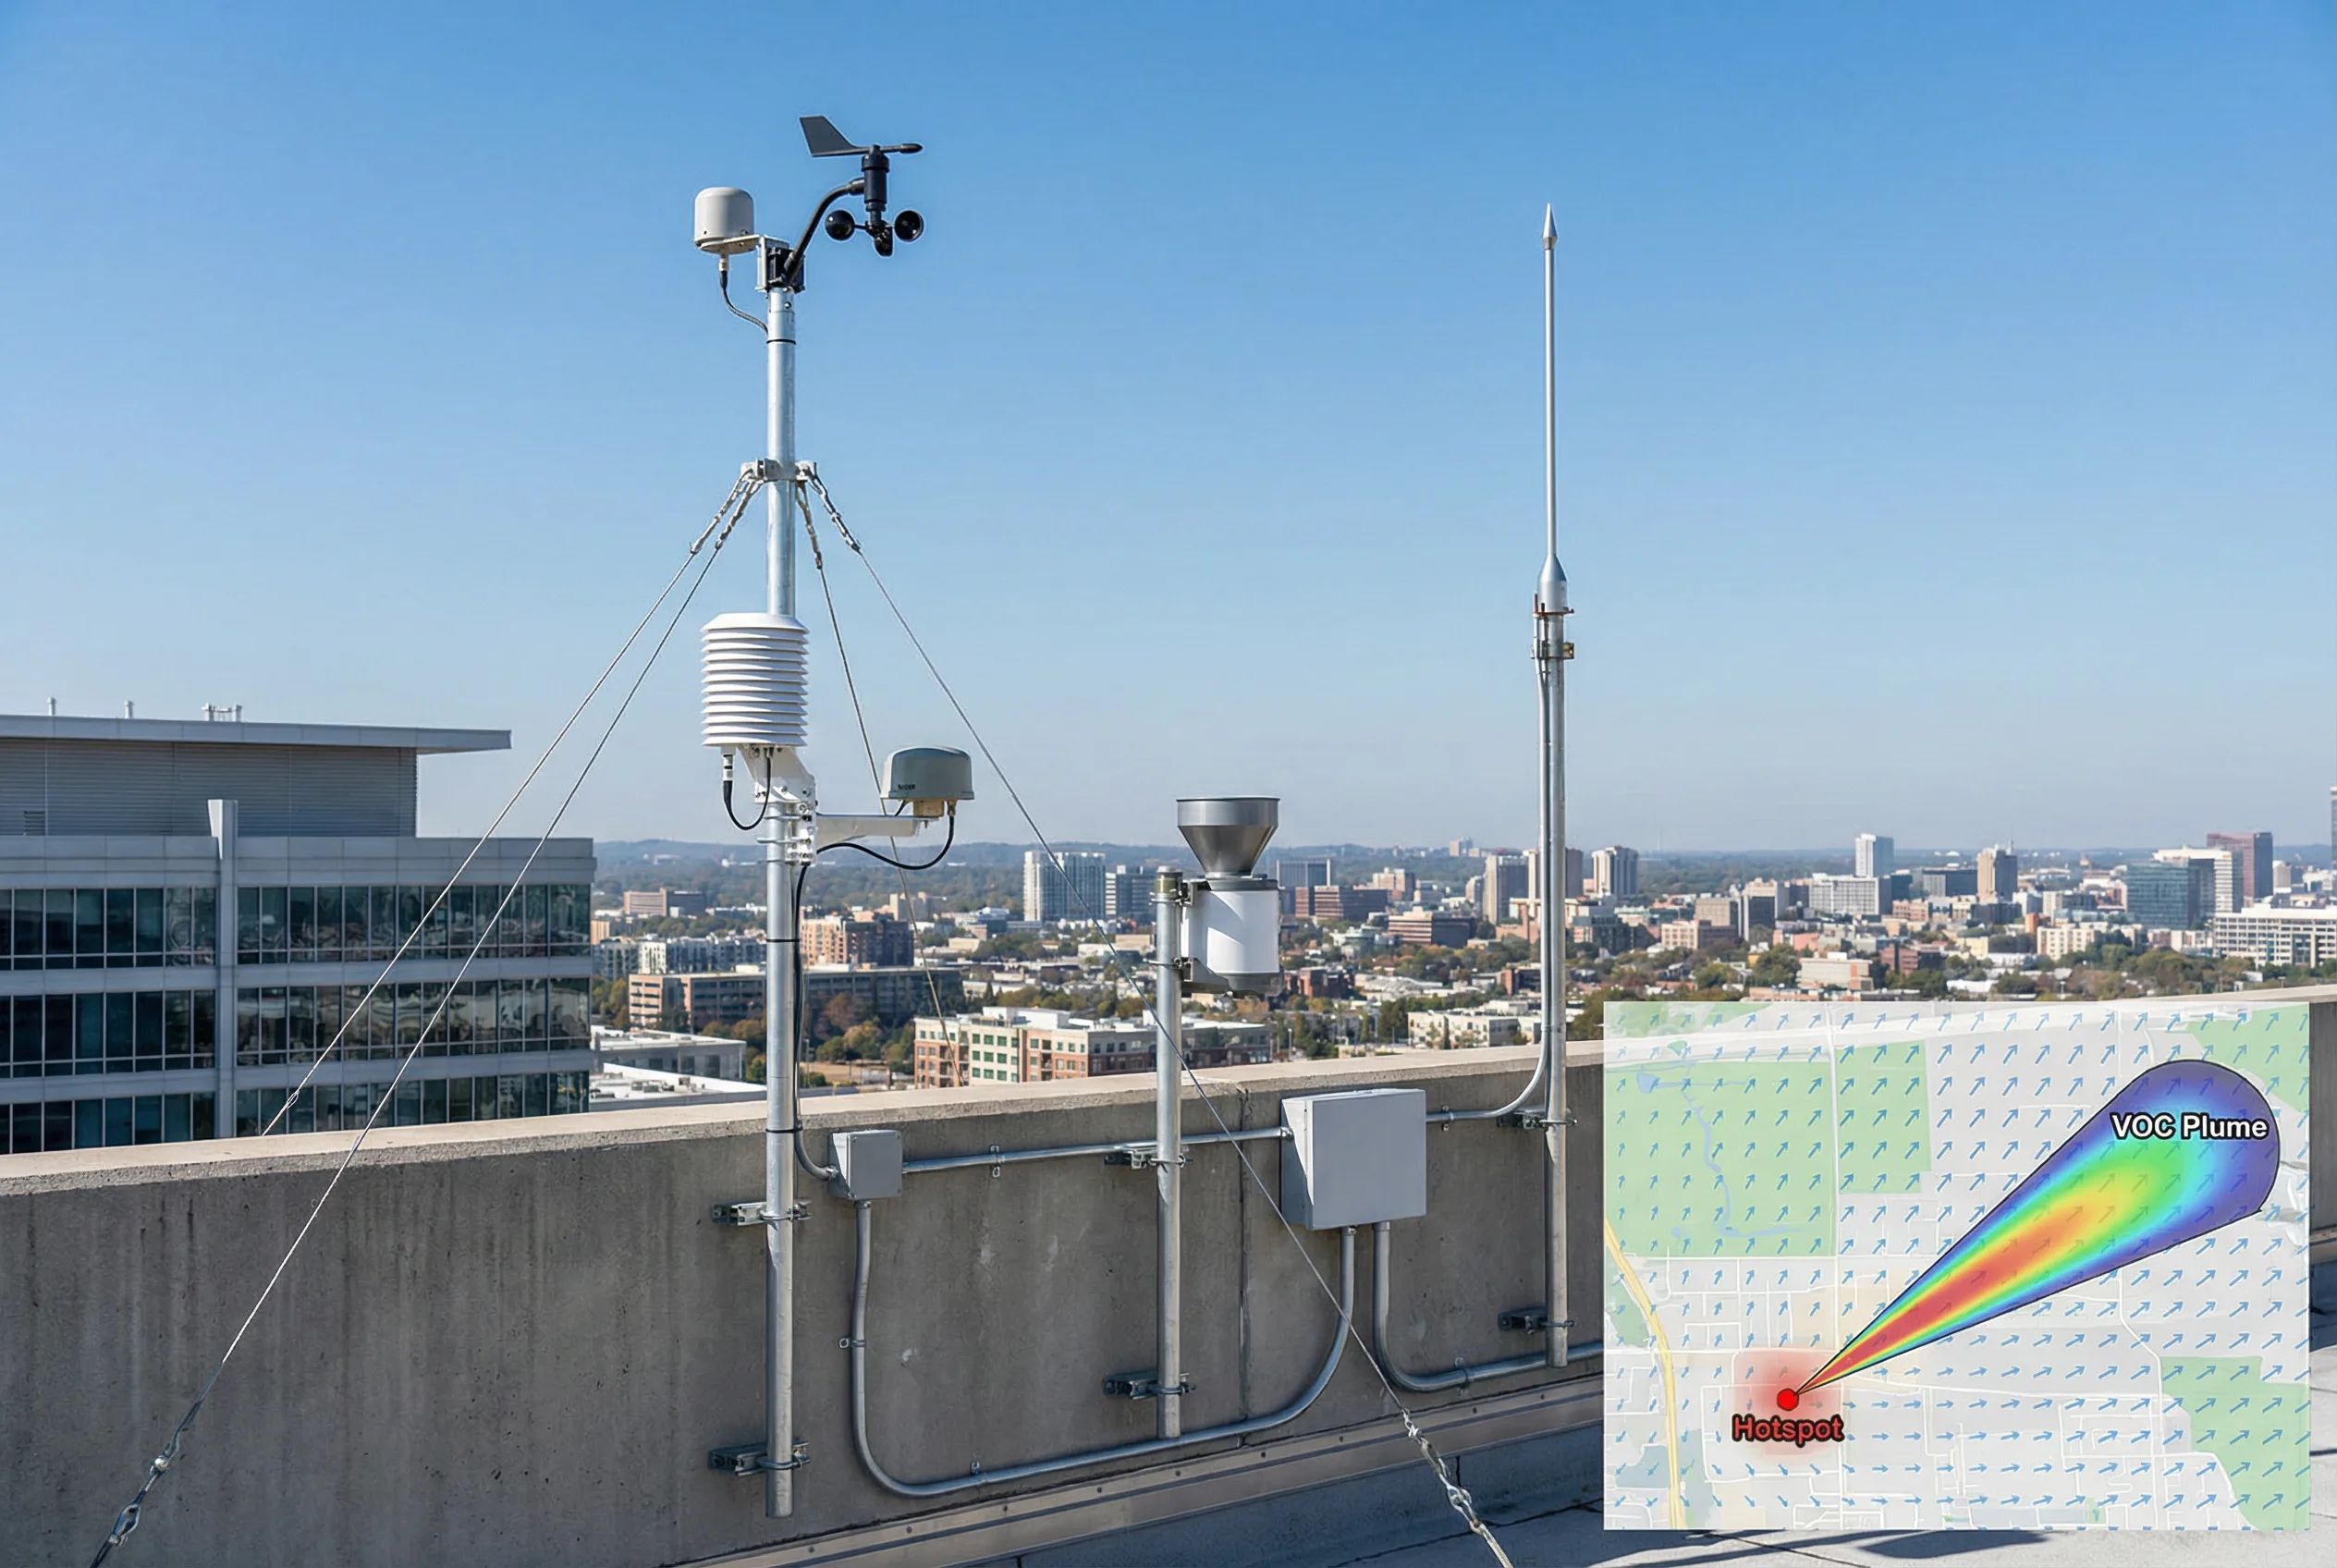
Meteorological data is the foundation of emergency response and odor complaint investigation in parks with multiple emission sources. Wind speed and direction data enable inference of plume trajectories and prioritization of response resources toward the most likely source zones. Siting is critically important: rooftop turbulence from HVAC equipment, parapets, and adjacent structures can corrupt wind measurements, requiring careful placement above the turbulence zone with adequate clearance from obstructions.
Emergency workflows depend on short alarm latency and clear escalation paths. The meteorological system must integrate with the VOC/odor monitoring network to provide composite alerts that combine concentration data with wind-driven plume inference. This enables EHS responders to receive actionable information — "VOC spike detected at Station 3, wind from NW at 3.5 m/s, probable source in Zone B" — rather than raw sensor readings.
Drill procedures are essential to validate the emergency response workflow before an actual incident. Regular drills test the complete chain from sensor alarm through platform notification to field response, identifying gaps in escalation paths, communication failures, and documentation procedures. Post-drill reports provide evidence of system readiness for regulatory audits.
| Parameter | Specification | Siting Requirement |
|---|---|---|
| Wind speed | 0.5–40 m/s range; ±0.3 m/s accuracy | ≥10m above rooftop obstructions; >10× obstacle height clearance |
| Wind direction | 0–360°; ±3° accuracy | Same mast as wind speed; avoid magnetic interference |
| Temperature | -30 to +60°C; ±0.3°C accuracy | Radiation shield; not above heat sources |
| Relative humidity | 0–100% RH; ±2% accuracy | Same radiation shield as temperature |
| Rainfall | Tipping bucket; 0.2mm resolution | Clear of obstructions; bird guard required |
Scenario 7 — Energy & Carbon Governance Correlation with Environment
Recommended Architecture: Standard | Connectivity: Ethernet/RS485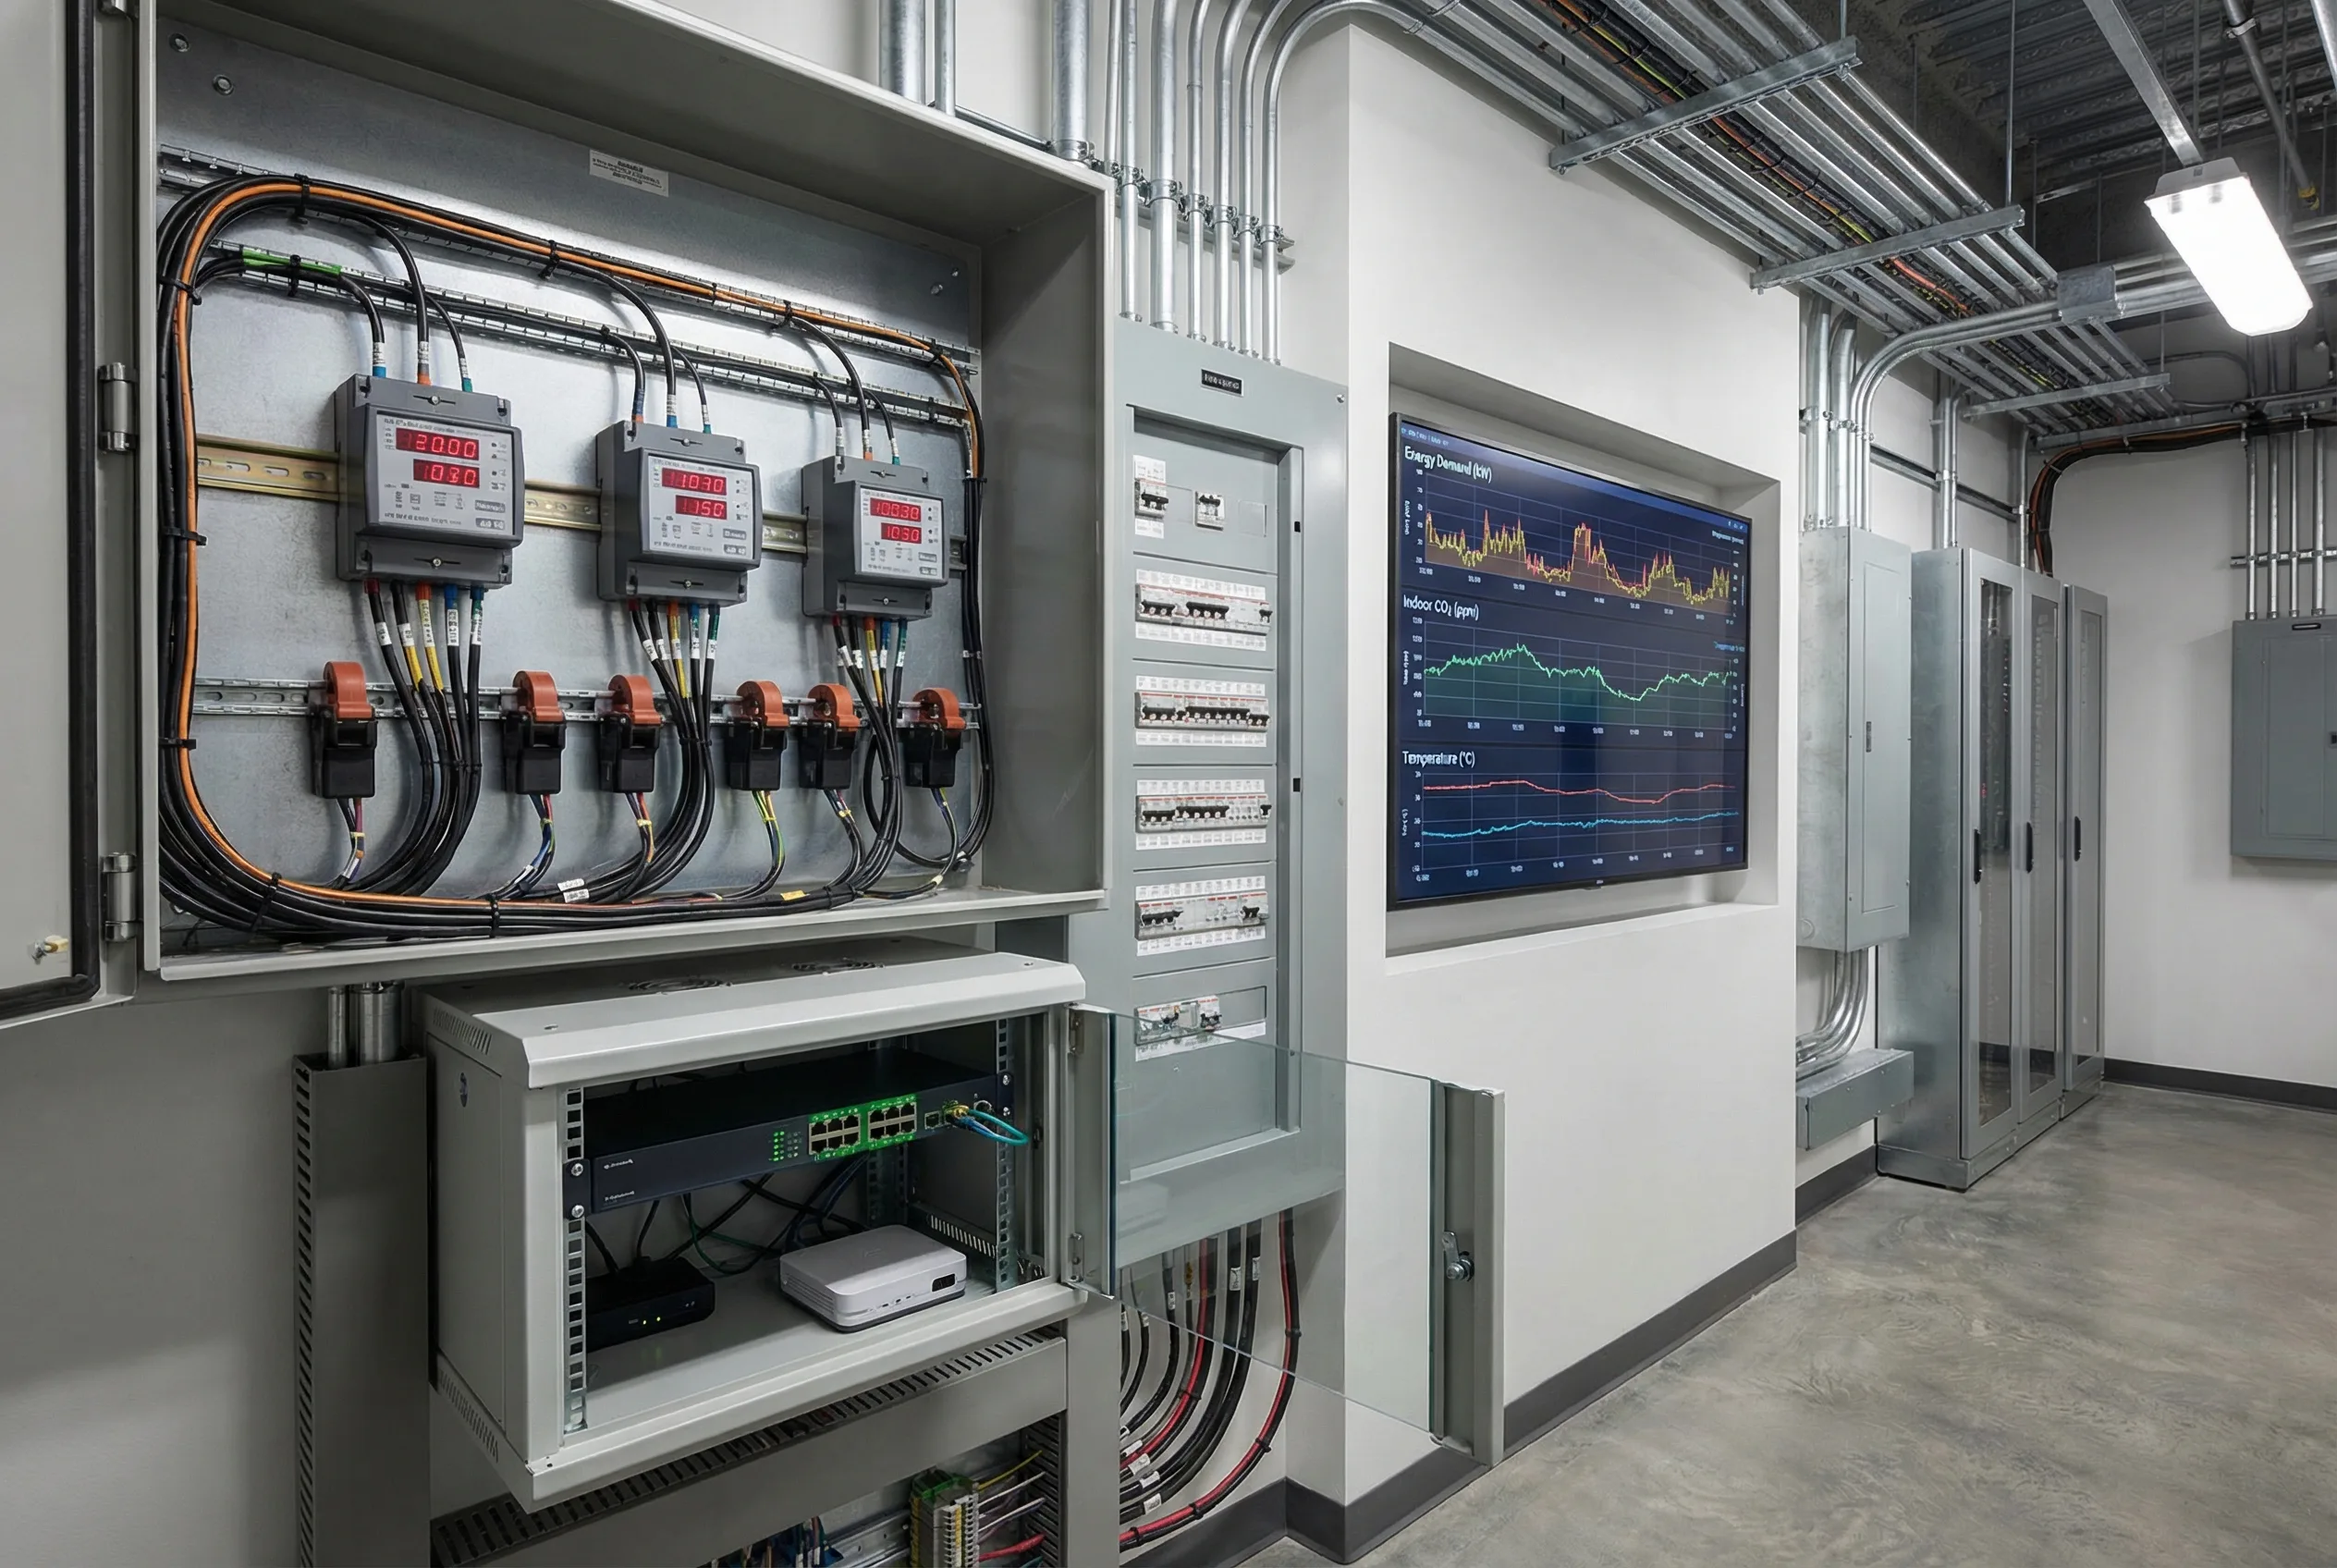
Correlating energy consumption with indoor environmental quality prevents the common failure mode of "saving energy by harming comfort" — where HVAC setback schedules reduce energy use but cause CO₂ and temperature excursions that reduce occupant productivity. By displaying energy demand alongside CO₂ concentration and temperature trends on the same dashboard, facility managers can identify the optimal balance between energy efficiency and comfort.
Meter wiring accuracy is the most common failure in energy monitoring deployments. CT ratio mismatches, incorrect phase mapping, and reversed CT polarity all produce systematic errors that corrupt energy KPIs and invalidate carbon accounting calculations. A rigorous commissioning procedure with cross-check against utility bills is essential to validate meter accuracy before the system goes live.
Data alignment by time synchronization is critical for meaningful correlation analysis. Energy meters, environmental sensors, and BMS data must all share a common time reference to enable accurate correlation of events across systems. The edge gateway's NTP synchronization ensures that all data streams are timestamped consistently.
| Metric | Target | Verification Method |
|---|---|---|
| Meter accuracy | Class 1 or better (±1%) | Cross-check against utility bill ±2% |
| Demand interval | 15-min intervals for peak demand analysis | Verify against utility tariff interval |
| Energy KPI accuracy | kWh/m²/year within ±3% of utility bill | Monthly reconciliation report |
| Comfort-energy balance | Comfort index ≥80 at energy target | Correlation chart review |
| Carbon accounting | Emission factor applied correctly | Methodology audit |
| Time sync | All meters and sensors within ±1s | Drift log review |
Scenario 8 — Mixed-Use Park: Retail + Office + Lab Zones
Recommended Architecture: Advanced | Connectivity: Hybrid Multi-Protocol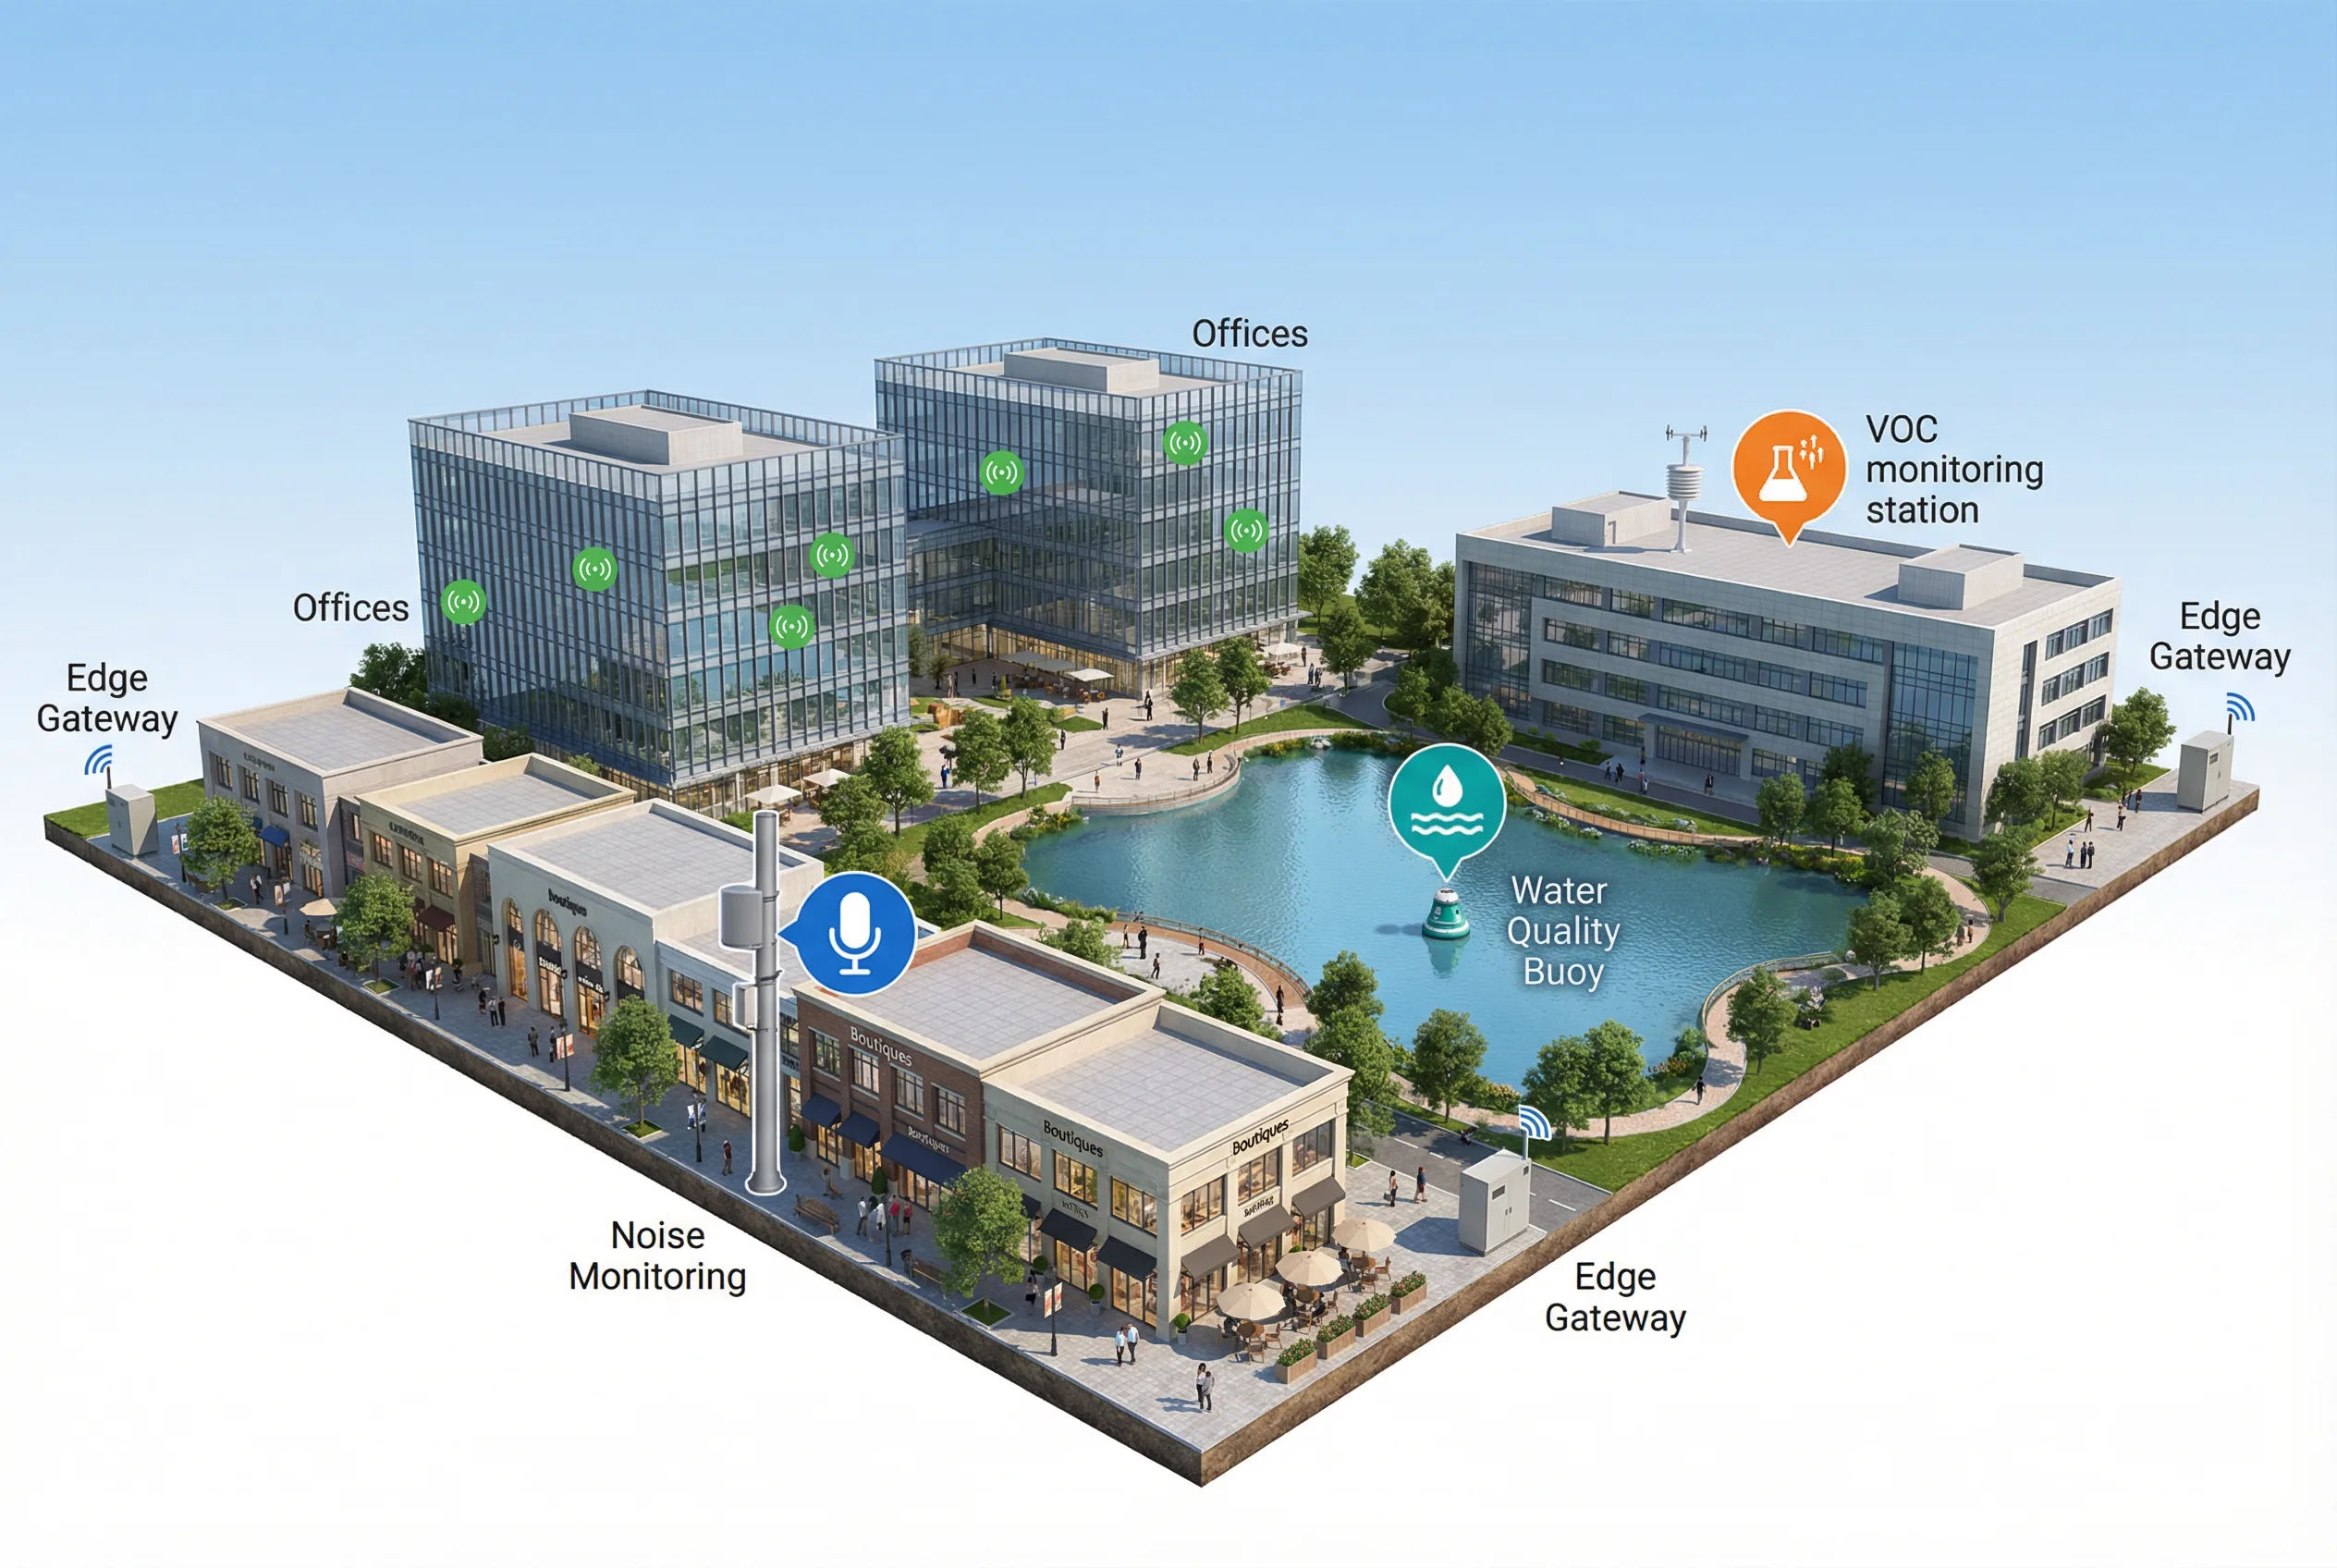
Mixed-use parks with retail, office, and laboratory zones present the most complex governance challenge: different tenants demand different metrics, different alarm thresholds, and different reporting formats, while the park management team requires a consistent taxonomy and unified view across all zones. The system architecture must support multi-tenant role-based access control that isolates tenant data while enabling park-wide aggregated views for the management team.
Expansion is frequent in mixed-use parks as new tenants move in and existing tenants change their operations. A plugin architecture with a schema registry and versioned APIs is essential to onboard new sensor types and new tenants without disrupting existing data flows. Supplier diversity — different sensor vendors for different zones — requires strict interface standards at the gateway level to ensure consistent data quality regardless of the underlying sensor technology.
Staged rollout is the recommended deployment approach: begin with the highest-risk zones (laboratory VOC, water quality), then expand to boundary monitoring, and finally to indoor comfort and energy monitoring. This approach allows the O&M team to build capability progressively and identify integration issues before they affect the full system.
| Zone | Primary Monitoring | Key Requirement |
|---|---|---|
| Retail street | Noise, ambient PM, pedestrian comfort | Aesthetic mounting; minimal visual impact |
| Office buildings | Indoor CO₂/TVOC/PM, temperature/humidity | PoE sensors; BMS integration; RBAC per tenant |
| Laboratory zones | VOC/chemical vapor, exhaust stack, safety gas | High-sensitivity sensors; local alarms; safety linkage |
| Central lake/water | Water quality: pH, turbidity, DO, temperature | Buoy or bank-mounted; anti-fouling; solar power |
| Boundary | Noise, PM, VOC, meteorology | Compliance evidence; wind correlation |
3.3 Scenario → Solution Mapping Matrix
The following matrix maps each deployment scenario to its recommended architecture tier, connectivity approach, edge buffer requirement, key sensors, and alarm strategy. This provides a rapid reference for system designers during the initial scoping phase.
| Scenario | Architecture | Connectivity | Edge Buffer | Key Sensors | Alarm Strategy |
|---|---|---|---|---|---|
| Industrial boundary | Standard/Advanced | Fiber + LoRa/NB | ≥7 days | Noise + PM + VOC + met | Multi-level + evidence pack |
| Construction dust | Basic/Standard | LoRa + 4G | ≥3 days | PM + met | ROC + geofenced alert |
| Indoor comfort | Standard | Ethernet/PoE/Wi-Fi | ≥24h | CO₂ + TVOC + PM + T/RH | Comfort index + SLA |
| Logistics yard | Standard/Advanced | Dual uplink | ≥7 days | Noise + PM/NO₂ + gas | Local beacon + escalation |
| Discharge points | Standard | 4G/NB + RS485 | ≥7 days | pH/EC/turbidity | Probe health + excursion |
| Emergency plume | Advanced | Fiber + 4G failover | ≥7 days | Met + VOC | Low latency + drill verified |
| Energy correlation | Standard | Ethernet/RS485 | ≥48h | Meters + environment | Anomaly + reporting |
| Mixed-use | Advanced | Hybrid | ≥7 days | Multi-domain | RBAC + tenant rules |
3.4 Solution Comparison
| Option | Best Fit | Pros | Cons | Typical Use | Cost Level |
|---|---|---|---|---|---|
| Basic (cloud + minimal edge) | Small parks, pilots | Fast deployment, low capex | Weak offline alarms, limited resilience | Pilot / low-risk monitoring | Low |
| Standard (edge zoning + HA platform) | Most parks | Balanced resilience and cost | More integration work required | Compliance + operations | Medium |
| Advanced (multi-edge, analytics, digital twin) | Large/high-risk parks | Best traceability and analytics | Higher O&M skill requirement | Chemical/lab/mixed-use zones | High |
3.5 Recommended Metric Ranges
| Metric | Recommended Range | Rationale | Acceptance Method |
|---|---|---|---|
| Alarm latency (critical) | 10–60 s | Emergency response requirements | Timestamp difference test |
| Alarm latency (general) | 1–5 min | Operational efficiency | Event replay analysis |
| Data completeness | ≥98% (core channels) | Governance integrity | Monthly completeness report |
| Time sync drift | <2 s/day | Correlation and traceability | Drift monitoring dashboard |
| Edge buffer duration | 3–14 days | Network outage tolerance | Unplug test with data recovery check |
| Map location error | <5 m | Traceability and GIS accuracy | GPS field measurement + audit |
| Noise measurement interval | 1s sampling, 1–15 min statistics | Compliance standard requirements | Device configuration proof |
| Water probe cleaning | Daily to weekly | Fouling control | Maintenance log review |