Design Methods
Engineering principles, failure cause analysis, core design decision logic, and key optimization dimensions for designing a resilient, compliant, and maintainable smart campus environmental monitoring system.
2.1 Design Principles & Basis
Effective system design begins with a set of executable engineering principles that guide every decision from sensor placement to data retention policy. The following twelve principles are derived from metrology best practices, field failure statistics, and operational experience across multi-tenant park deployments. Each principle includes its engineering basis to enable verification and traceability.
| # | Principle | Engineering Basis |
|---|---|---|
| 1 | Risk-based zoning: Place dense sensors where emissions and complaints occur; use sparse coverage elsewhere. | Site risk assessment and historical incident analysis |
| 2 | Measurement integrity first: Define QA flags, calibration lifecycle, and siting rules before dashboards. | Metrology best practice and audit requirements |
| 3 | Edge-first resilience: Buffer and local alarming at edge to survive network and platform outages. | Availability requirements and field outage statistics |
| 4 | Separation of duties: Operations vs compliance roles have distinct RBAC and audit trails. | Security governance and regulatory requirements |
| 5 | Time is a first-class field: Strict NTP/GPS time sync with drift monitoring on every device. | Traceability, correlation, and evidence integrity |
| 6 | Schema governance: Enforce naming conventions, units, and metadata from day one. | Long-term maintainability and multi-vendor interoperability |
| 7 | Interoperability by design: Prefer open protocols (Modbus, MQTT, OPC UA gateway) and documented APIs. | Multi-vendor park environments and procurement policy |
| 8 | Alarm fatigue control: Implement deduplication, hysteresis, and event grouping from the start. | Operational efficiency and incident response effectiveness |
| 9 | Data retention by tiering: Hot time-series storage plus object storage archive with defined policies. | Cost optimization vs compliance retention requirements |
| 10 | Maintenance accessibility: Design poles and cabinets for safe access and probe replacement. | O&M safety requirements and MTTR targets |
| 11 | Lightning and grounding are mandatory outdoors: Multi-level surge protection at device, cabinet, and entry points. | Field failure statistics showing surge as primary failure cause |
| 12 | Acceptance is designed upfront: Every metric has a defined test method and evidence artifact. | Project delivery control and contractual compliance |
2.2 Failure Causes & Engineering Recommendations
Field deployments consistently reveal a set of recurring failure patterns that account for the majority of system downtime, data quality issues, and compliance failures. The table below maps each failure cause to its underlying mechanism, the recommended engineering countermeasure, and the verification method to confirm the countermeasure has been correctly implemented during commissioning and acceptance testing.
| Failure Cause | Mechanism | Engineering Recommendation | Verification Method |
|---|---|---|---|
| Poor sensor siting | Turbulence, obstruction, acoustic reflections | Follow height/clearance rules; avoid corners and downwind obstructions | Site photo + siting checklist review |
| Condensation ingress | RH cycling, seal failures, temperature differentials | IP65+ enclosure, breathable membrane, anti-condensation heater | Soak test + RH log analysis |
| Protocol mismatch | Vendor register map variants, byte order differences | Protocol adapter library with FAT using device simulators | Register validation report against device datasheet |
| Power noise | Shared loads, inductive switching, surge events | Dedicated circuit, Type II/III SPD, UPS for gateways | Power quality snapshot under load |
| Clock drift | No NTP server, unstable RTC, blocked NTP port | NTP with periodic GPS sync; monitor drift trend | Drift trend log showing <2s/day |
| Alarm floods | Thresholds too sensitive, no hysteresis | Implement hysteresis, rate-of-change rules, and event grouping | Alarm volume KPI review over 30-day period |
| Calibration ignored | Drift accumulates; no enforcement mechanism | Enforce calibration expiry — suppress alarms and compliance scores when expired | Calibration audit trail completeness check |
| Network single point of failure | Single uplink; no store-and-forward | Dual uplink (fiber + 4G/LTE) with automatic failover and edge buffering | Failover test by disconnecting primary uplink |
| Data tampering risk | No transport encryption or integrity signing | TLS 1.2+ transport, integrity hash, immutable audit log | Evidence package integrity check and packet capture |
2.3 Core Design & Selection Logic
The design process follows a structured decision sequence that begins with defining primary objectives and ends with a finalized bill of materials and rollout plan. The decision tree below illustrates how different objective priorities lead to different sensor domain requirements, connectivity choices, and architecture tiers. This structured approach prevents scope creep and ensures that every design decision is traceable to a documented requirement.
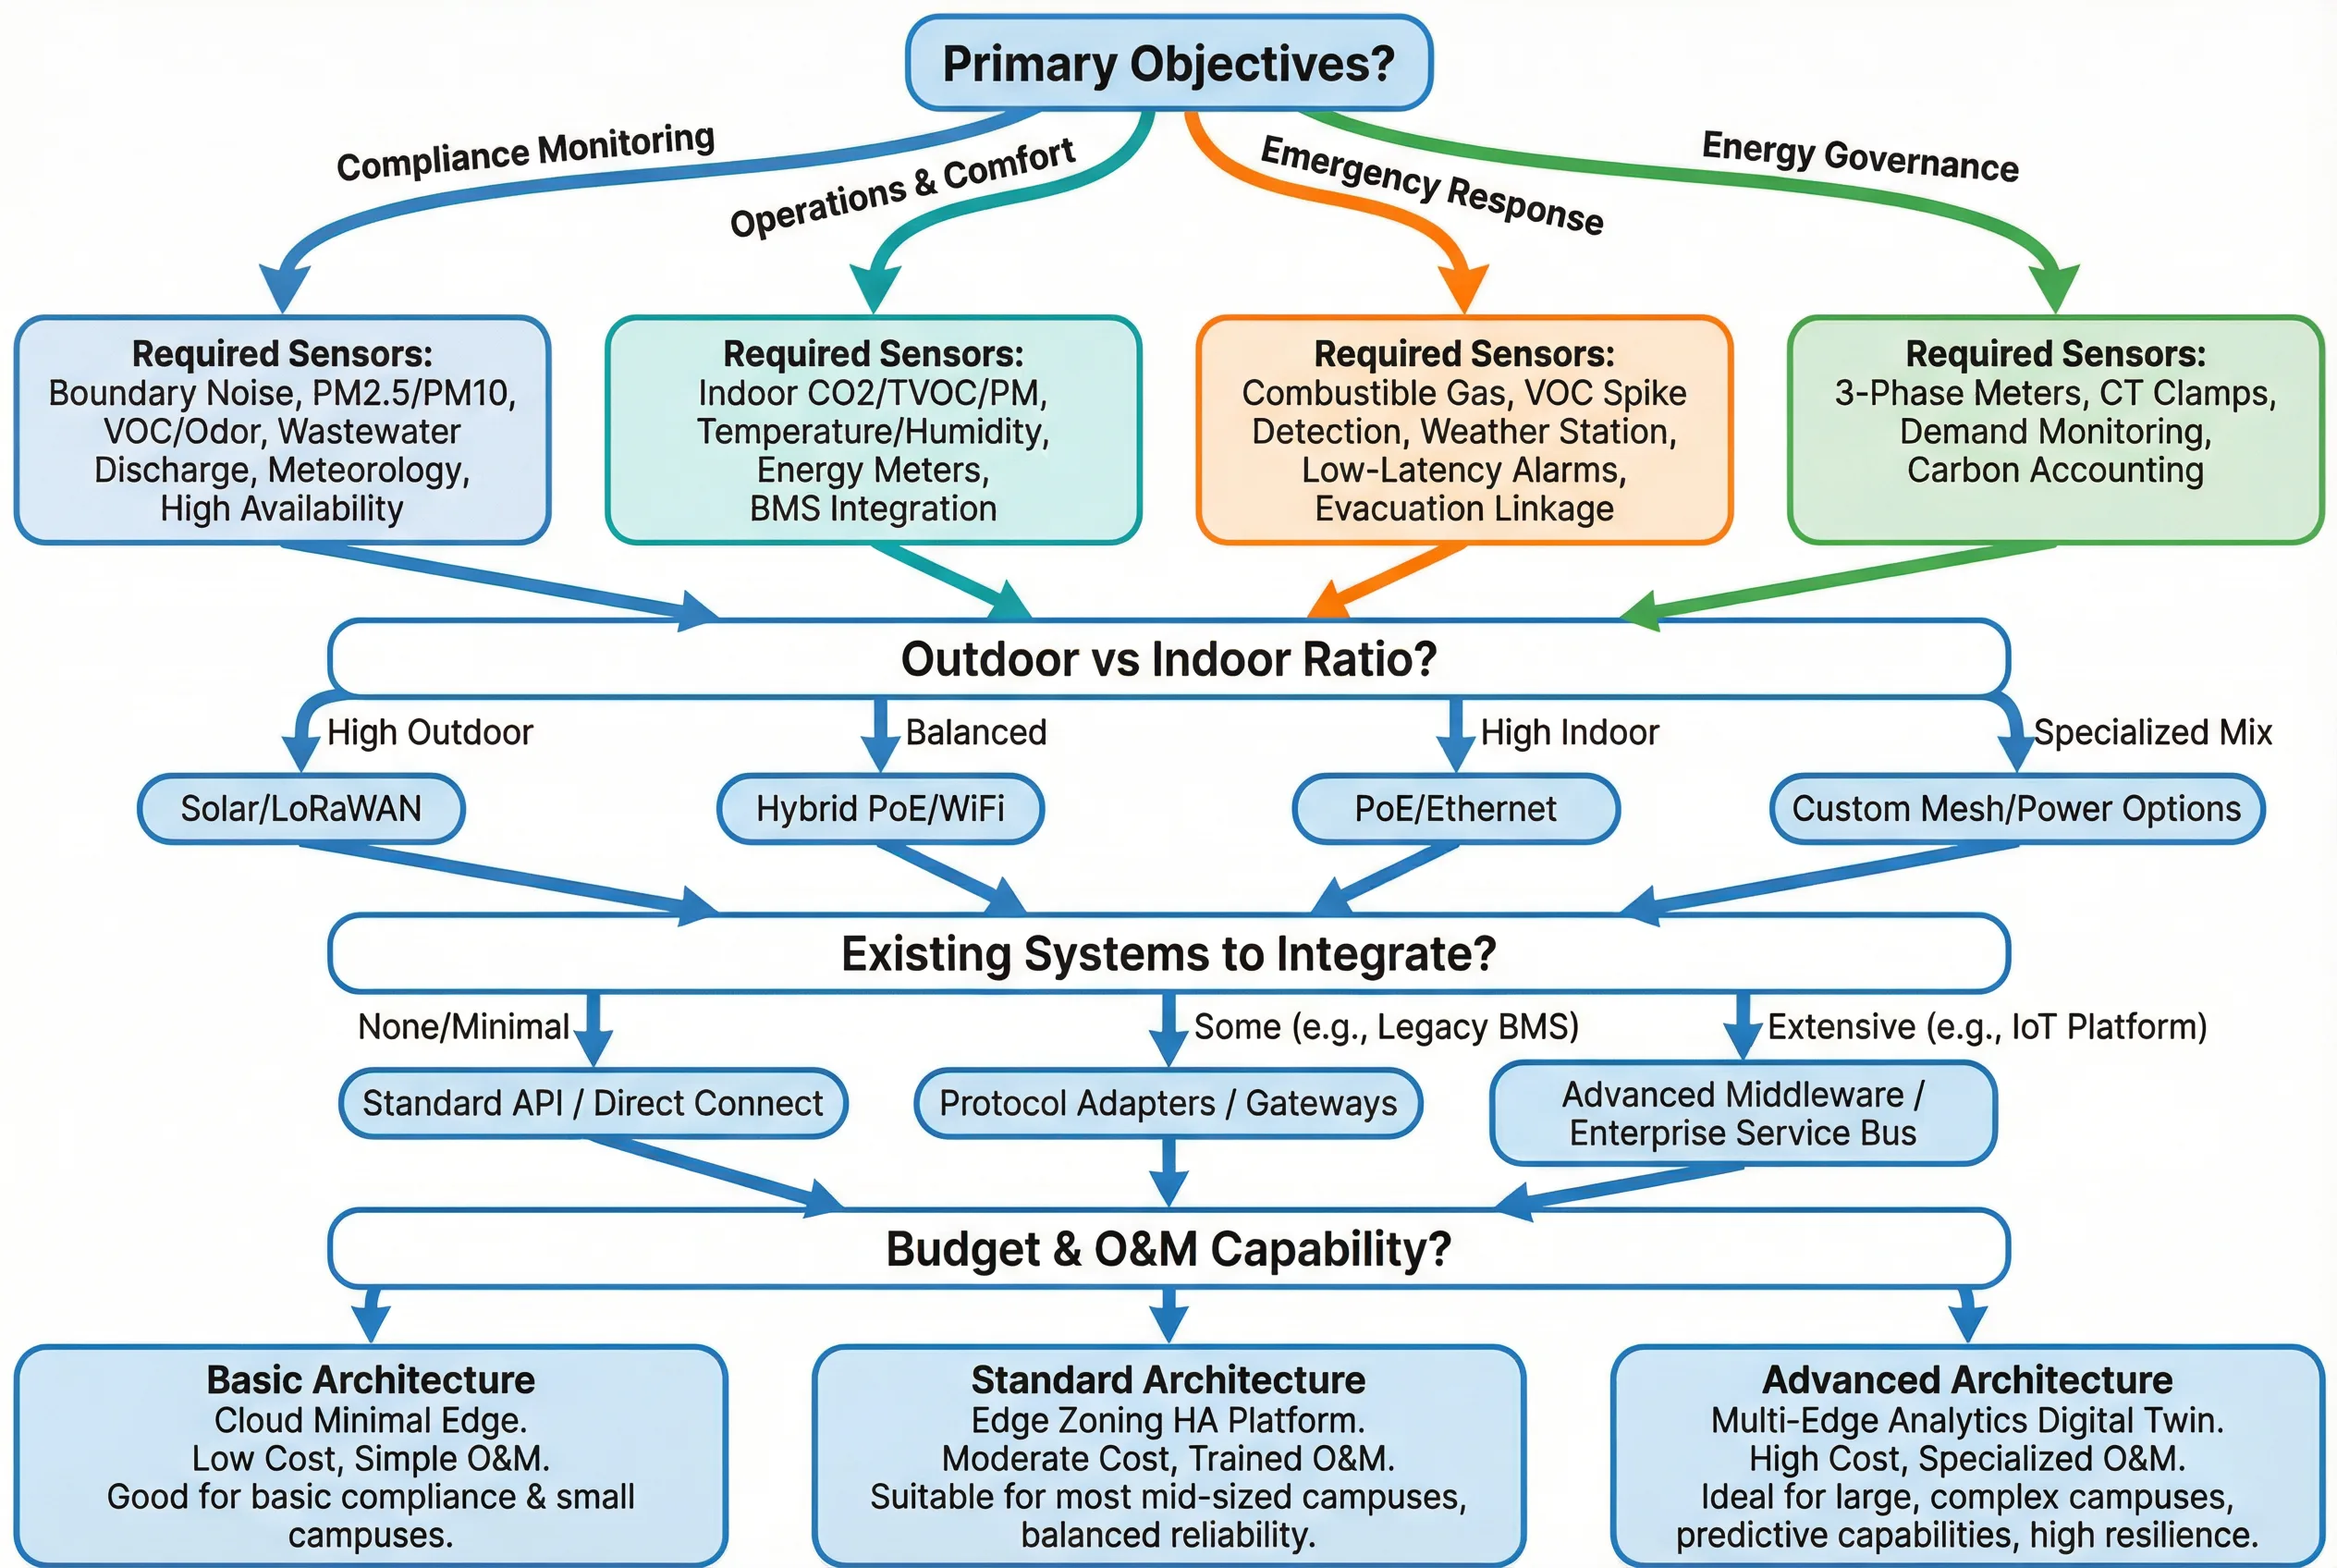
Figure 2.1: Core Design Selection Decision Tree — From Objectives to Architecture Tier
Step-by-Step Design Sequence
- Define primary objectives (compliance, operations comfort, emergency response, energy governance)
- Define monitoring zones and risk points based on site survey and historical incidents
- Define the factor list per zone (which pollutants, parameters, and safety factors to measure)
- Determine sampling intervals, alarm latency requirements, and retention periods
- Choose connectivity and power infrastructure based on outdoor/indoor ratio and site constraints
- Size edge gateways and central platform based on device count and data volume
- Define alarm taxonomy and workflow escalation paths
- Define acceptance tests and evidence artifacts for every key metric
- Finalize BOM, integration requirements, and phased rollout plan
2.4 Key Optimization Dimensions
System design must balance multiple competing dimensions simultaneously. The following framework provides a structured way to evaluate design trade-offs and communicate priorities to stakeholders. Each dimension has measurable indicators that can be tracked throughout the project lifecycle.
| Dimension | Key Metrics | Design Levers | Trade-off Risk |
|---|---|---|---|
| Performance & Experience | Alarm latency, dashboard load time, report generation speed | Edge stream rules, platform sizing, caching | Over-engineering increases cost without proportional benefit |
| Stability & Reliability | Platform uptime, data completeness, MTBF | Dual uplink, HA services, edge buffering, degradation modes | High redundancy increases complexity and O&M burden |
| Maintainability | MTTR, calibration compliance rate, spare availability | Modular probes, accessible mounting, remote OTA, spares policy | Lowest-cost sensors often have highest maintenance cost |
| Compatibility & Expansion | Protocol coverage, API version stability, onboarding time | Plugin protocol adapters, schema registry, API versioning | Too many protocols increase integration complexity |
| Life Cycle Cost (LCC) | Calibration cost, consumables, bandwidth/storage fees | Calibration intervals, compression, tiered storage | Lowest capex often has highest opex over 5 years |
| Energy & Environment | Power consumption, solar viability, recyclable parts | Low-power nodes, solar + battery for remote points | Solar-only unreliable in low-irradiance seasons |
| Compliance & Certification | Instrument class, audit log completeness, retention integrity | Calibration enforcement, WORM archive, evidence packaging | Regulatory changes may require sensor upgrades |